By Mitch Randall
Introduction
On April 28, 2011, Andrea Rossi demonstrated the device he calls the “Energy Catalyzer” to Mats Lewan of Ny Teknik in his video “Ny Teknik Tested the Energy Catalyzer.”
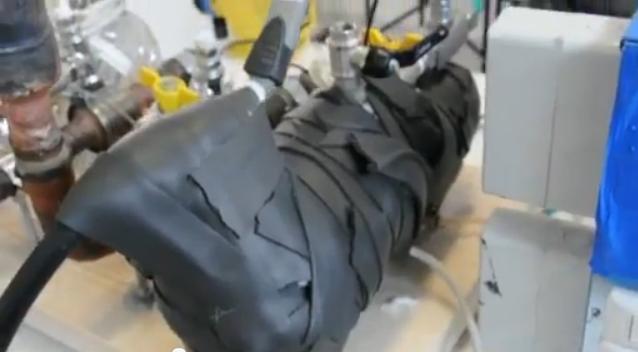
Figure 1 Rossi's "Energy Catalyzer" as seen in the Ny Teknik video
On June 30, 2011, New Energy Times published “Report 3,” which included Appendix 10, which shows that Rossi adjusted the power controls at the same moment Lewan walked into the adjacent room and videotaped the steam coming out of the outlet hose, which, at the time, was dunked in a bucket. Immediately after, Lewan walked back into the room with the E-Cat and found Rossi with his hand at the power controls. Appendix 10 demonstrates that the only reason Rossi would be at the power controls is to perpetrate deception.
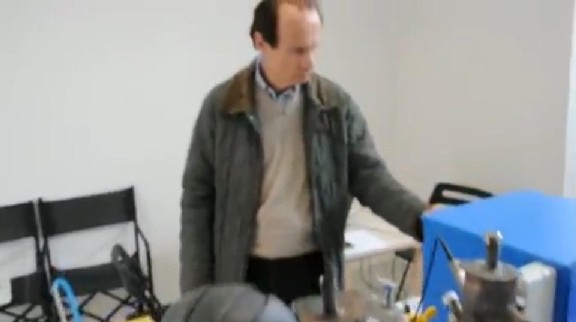
Figure 2 Rossi caught adjusting the power controls after Lewan filmed steam
After June, Lewan made available the temperature log that Rossi recorded during that demonstration. The temperature log demonstrates two important points. First, the data confirms that Rossi could not have used it to control his device; there is simply not enough information available from the temperature sensors on which Rossi could base any adjustment of his device. Second, the data shows that a slight increase in temperature occurred as Lewan videotaped the onset of steam, confirming that Rossi did, in fact, adjust the power at that time.
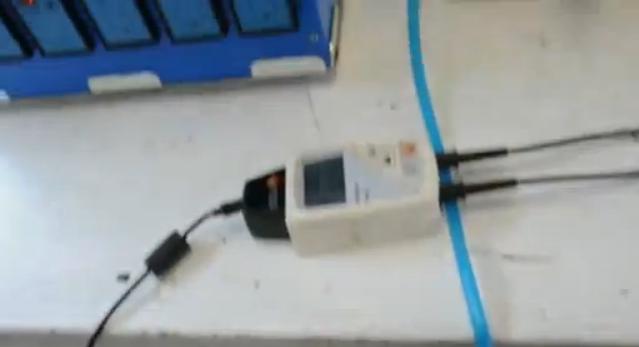
Figure 3 Data logger used to record three temperature sensors
The temperature log data supports the conclusion of Appendix 10 that Rossi changed power deceptively during the Lewan video. In fact, I was able to use the temperature log data to accurately predict the exact time of an earlier deception by Rossi. The full temperature log revealed that, before the beginning of Lewan’s published video, another similar event occurred. In an email to me, Lewan confirmed that, just before the video that he published, he recorded a first video that he chose not to publish. He confirmed to me that he videotaped steam starting to appear at precisely the time of the temperature surge visible in the log. He further confirmed that, in this unpublished video, Rossi was again at the controls just after Lewan filmed the steam output.

Figure 4 Rossi’s expression immediately after Rossi sees that Lewan filmed him adjusting power
New Energy Times ’ Appendix 10 of Report 3 asserted that Rossi perpetrated deception – deception that readers can see for themselves by watching the Ny Teknik video. The new information from the temperature log, as shown below, decisively confirms this assertion. The Ny Teknik video and the temperature log, along with the context and understanding provided below, show that Rossi perpetrated deception.
Review of Appendix 10 of New Energy Times Report 3
First, let’s review the results of Appendix 10 of Report 3. The key development of the report is the deduction that the front panel of Rossi’s device controls heater power and nothing else. Before this report, Rossi could easily mislead an unsuspecting and eager audience by relying on people’s imaginations to justify his tinkering with the then-unknown controls. However, armed with the information of this report, audiences know that, when Rossi is at the controls, he is adjusting heater power, and they can question why he is doing that.
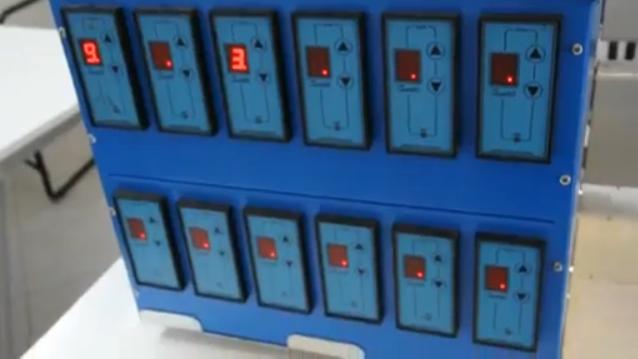
Figure 5 Front panel controls consist of only power adjusters
A further development of Appendix 10 is that Rossi has almost no information on which to base adjustments to the E-Cat system. His laptop is the only source of system information, and it shows only three temperatures, two of which are irrelevant and the third of which varies only minutely.
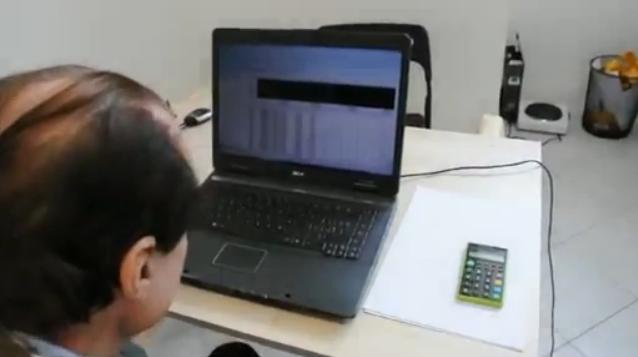
Figure 6 Rossi's laptop displaying exactly three temperatures
What’s more, Appendix 10 shows that the system has no automatic adjustment. Any adjustment of the system happens only when Rossi adjusts heater power in response to his observation of only one, nearly constant variable: the temperature of boiling water in the outlet chamber.
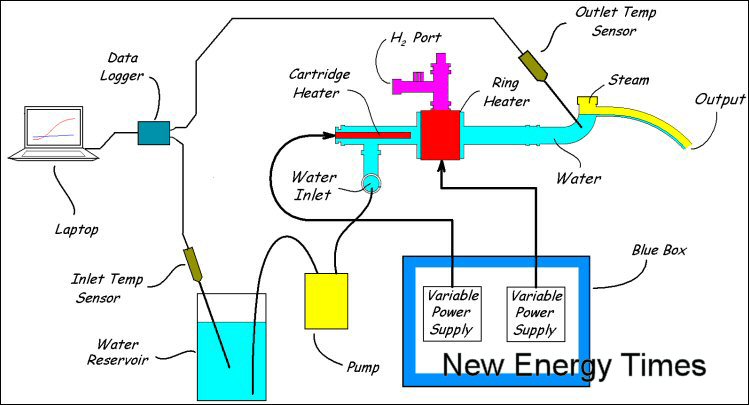
Figure 7 Diagram of E-Cat. Note the lack of automatic control
These facts reveal a profound situation: Rossi claims to have an extraordinary, world-changing device, yet its control system is less-sophisticated than a household water heater.
However, Appendix 10 goes on to reveal what could probably best be described as nothing more than a parlor trick. Appendix 10 details the events of the video to show that the steam increases just as Lewan films it. Immediately after he films the steam, Lewan walks back into the room with Rossi and his E-Cat. Lewan’s camera finds Rossi at the power controls.
Figure 8 Rossi adjusting heater power
The obvious conclusion is that Rossi deceived Lewan. However, if there was any doubt, Appendix 10 presents the argument that, if Rossi had a legitimate reason to adjust the power, he should have told Lewan he did so, because Lewan assumed that the power was constant during the demonstration. Rossi did not tell Lewan that he was adjusting the power input. Until Appendix 10 was published, Rossi could assume that no one knew what he was doing when he adjusted the power controls. However, we now know that he could only have been adjusting heater power.
Temperature Log Data
Rossi’s device is instrumented to measure and log exactly three temperatures, which are then displayed on his laptop. The three temperatures are 1) Inlet Water Reservoir Temperature, 2) Ambient Air Temperature, and 3) The Temperature of Boiling Water in the Outlet Chamber of the Device.
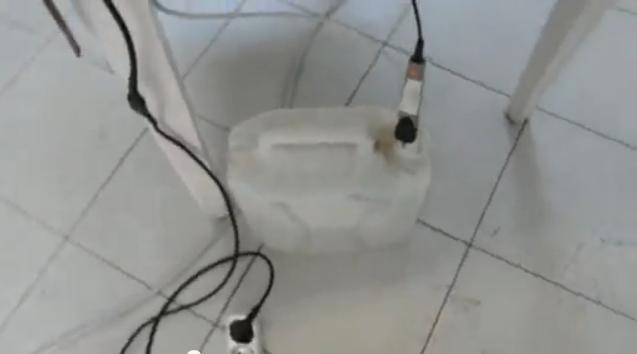
Figure 9 Temperature sensor monitoring inlet water reservoir
Inlet Water Temperature remains constant at 19.3C for the duration of the test. Ambient Air Temperature increases insignificantly from 20.5C to 20.6C during the test. Because these temperatures do not change appreciably during the test and because they are not relevant to the operation of the device, I do not discuss them further.
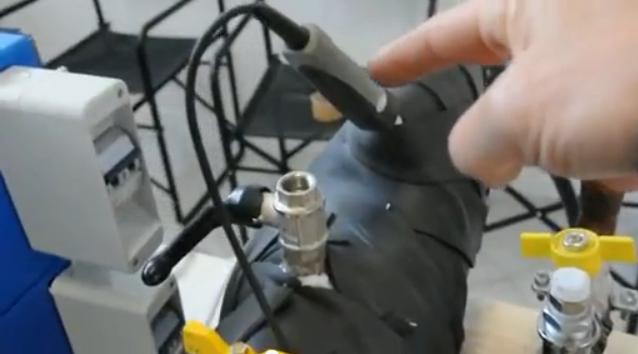
Figure 10 Temperature sensor monitoring boiling water in outlet chamber
Figure 11 shows the log of the Temperature of Boiling Water in the device. The graph is annotated with red markers indicating the events of the video.
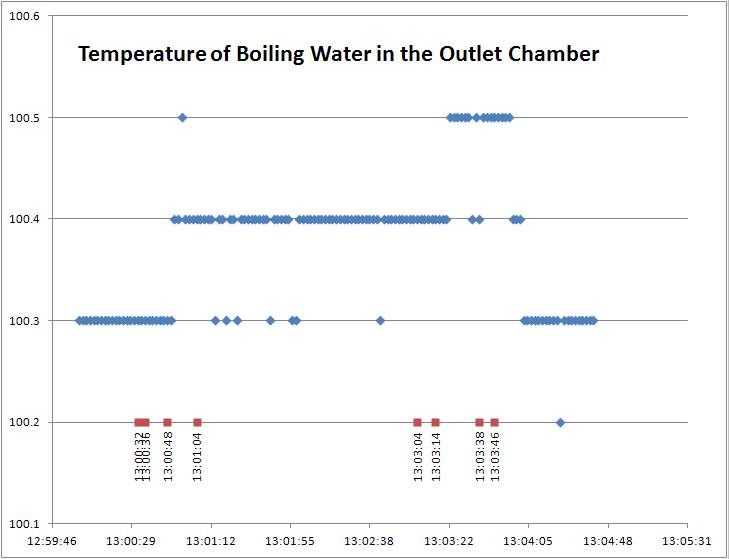
Figure 11 Temperature of boiling water in outlet chamber captured during filming of Ny Teknik video
Event log corresponding to the temperature of boiling water in the outlet chamber shown above:
13:00:32 Rossi says, “100.3.”
13:00:36 Rossi reaches to the right toward the heater power controls.
13:00:48 Lewan films close-up of Ammeter measuring input current.
13:01:04 Lewan films digital power adjuster settings. They are set at 9 and 3.
13:03:04 Lewan starts walking toward the room with the bucket. No steam activity is clearly visible or audible.
13:03:14 Lewan pulls the hose out of the bucket. Steam activity becomes noticeable.
13:03:38 Lewan puts the hose back in the bucket and walks back into the main room. Steam is still noticeably audible.
13:03:46 Rossi takes his hand away from the input power controller.
First, notice that the resolution of the temperature probe is 0.1C and the temperature is 100.4C +/- 0.1C, with just one point at 100.2C. If 0.1C changes are important for the control of the device, Rossi needs a temperature sensor with much greater resolution to distinguish sensor noise from actual temperature changes. However, he does not use such a sensor.
The logged temperature data reveal another profound fact: Rossi controls his extraordinary device based on minute changes in the boiling point of water rather than on the temperature of the reactor core. The resolution of the sensor he uses is too poor for him to distinguish these changes from measurement noise.
However, what is most important in the graph is the slight temperature rise corresponding to the time that Lewan removes the hose from the bucket. At 13:03:22, the temperature rises from 100.4C to 100.5C. Immediately after, at 13:03:46, Lewan’s video shows Rossi at the controls. The temperature log also shows that, at 13:03:54, the temperature decreases from 100.5C to 100.4C.
Analysis
Note that the temperature of the outlet water is greater than the temperature expected of boiling water at the local barometric pressure. In Bologna, Italy, and for the conditions of that day, water should have boiled at 99.5C. The elevated boiling point is the result of the slight back-pressure required to push the steam through the hose and out of the end of it, which was submersed slightly in the bucket of water.
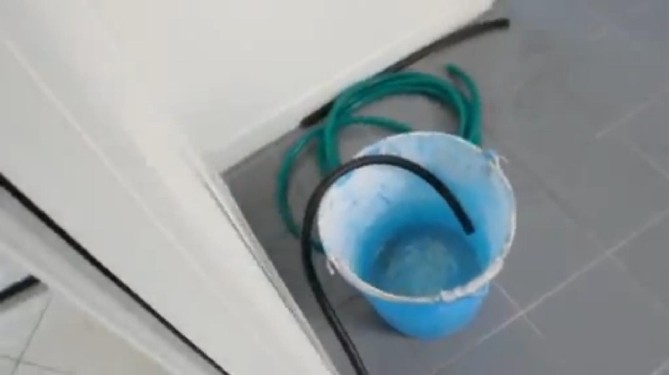
Figure 12 Outlet hose end is submerged in water
One remaining question is whether this temperature variation could be a result of the hose’s being removed from submersion in the bucket. However, removal of the hose from the bucket would decrease the pressure, thus lowering, not raising, the temperature of the boiling water.
The temperature surge could be a coincidence, but this hypothesis is weak, and I explain later why we can rule it out.
The most compelling explanation for the temperature surge is that it is the result of increased heater power. Therefore, the observed temperature rise of the boiling water confirms that Rossi raised the power level during the time that Lewan filmed the steam output.
A Prediction
On August 29, 2011, in an email from Lewan, I learned that he recorded an earlier video that he did not publish. He filmed this first video at 12:51:00, 11 minutes before he filmed the second video, which he did publish. On my inspection of the full data set, I noticed a similar temperature surge event during the time Lewan filmed the first video. This led me to make a prediction:
From: Mitch Randall
Date: den 29 augusti 2011 17:09
To: Mats Lewan
Subject: Re: SV: Power settings as a visual log
Mats,
The data from 12:51:00 to 12:54:12 shows a similar surge near the end at about 12:53:30.
I'm going to guess that you taped the steam at about 2:30 into the video.
If this is true, the hypothesis of coincidence should definitively be ruled out.
What's left is either the hypothesis of fraud or the hypothesis that pulling the steam from the bucket makes the temperature jump.
I'm interested to see the video and look for a correlation between its events and the internal temperature.
Best regards,
Mitch
|
In response to my prediction, Mats Lewan replied with the following email:
From: Mats Lewan
To: Mitch Randall
Sent: Monday, August 29, 2011 1:33 PM
Subject: SV: SV: Power settings as a visual log
From the [first] video:
0:00 – 0:30 Power 9 and 3, seen in video (Rossi far from the controls)
0:35 – 0:47 Ammeter 11.6 A
2:23 Pulled hose out of water
3:04 Rossi at the controls
3:11 End of video
Then another strange data: A similar but steady increase in temperature between 14 and 14:30, up to 100.8 degrees, with no apparent reason (I’m quite convinced Rossi didn’t touch the equipment during this interval). Then suddenly decrease to 100.6 at 14:30.
At 14:32, I have a note of added water to the inlet reservoir, but there was no change in inlet temperature, as the water we used was in another reservoir next to [the reservoir] from where the pump [was], thus with exactly the same temperature.
Mats
|
The temperature log allowed me to predict the exact moment when Lewan filmed steam exiting the hose in a video I had never seen. In addition, Lewan said that Rossi was again at the power controls immediately after the steam event.
The hypothesis that it is a coincidence that Rossi’s device had a temperature surge just as Lewan approached the bucket is ruled out because it does not represent just one coincidence, but many, and it explains little else that we now know. A list of the coincidences required for this hypothesis is as follows: First, the temperature increased as Lewan approached the bucket in the published video. Next, the temperature decreased as Lewan approached Rossi. There are two more such coincidences in the first, unpublished video. Further, not only was Rossi at the controls when Lewan approached him, but he was also just finishing his adjustment of them. Rossi was also at the controls in the unpublished video. This totals to seven coincidences.
What remains unexplained are the very low amount of steam observed as Lewan approached the bucket, the change in steam output when Lewan pulled the hose out of the bucket, Rossi’s presence at the power controls in both videos, the fading of the steam when Lewan stood before Rossi, and the temperature surge itself.
Thus, we can decisively rule out the hypothesis of coincidence because it requires the improbability of six coincidences and leaves several inconsistencies unexplained. However, the hypothesis of deception does not require any coincidences and neatly explains all of the observed events in question.
Temperature Data Raise Questions About Rossi’s Behavior
At times during the Ny Teknik video, Rossi appears focused intently while studying his laptop screen. Rossi then appears to make adjustments to the device based on this information.
For example, in the first 38 seconds of the published Ny Teknik video, Rossi is staring at the computer screen.
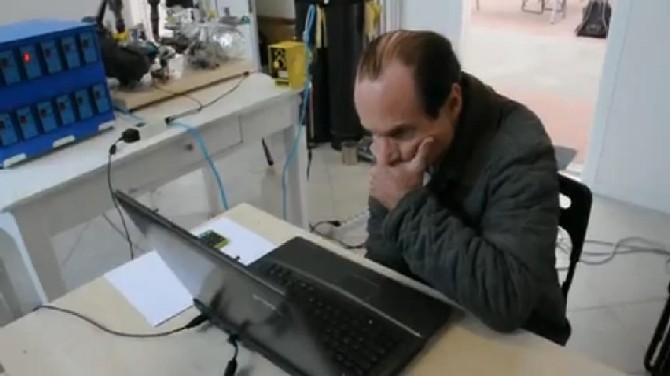
Figure 13 Rossi showing great interest in the temperature data
At 13:00:36, apparently based on the information he has been studying, Rossi turns and stretches his hand toward the power controls.
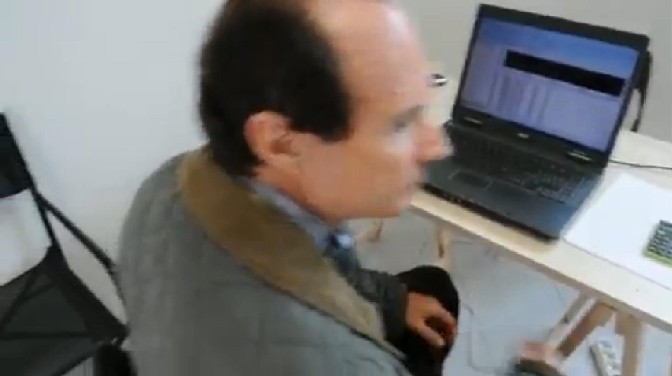
Figure 14 Rossi moves toward the control box to make an adjustment
At the time the video was filmed, these actions would not raise any concerns; they seem to be consistent with an inventor operating his device. However, let’s consider in detail what is happening during this sequence in light of what we now know.
Since the publication of Appendix 10, we know that Rossi’s laptop serves only one function: displaying the readings of three temperature sensors. We know that the system does not have any form of automatic control, so that Rossi must manually make any adjustment of the system. Further, we know that the only parameter Rossi can adjust is heater power.
Of the three temperature measurements, two are irrelevant, and the third is the temperature of boiling water in the outlet chamber of the device. Nevertheless, Rossi appears highly interested in this data and able to use this information to adjust heater power to control the system.
Despite Rossi's deep contemplation of the input data and then, based on that, his adjustment of the device, the temperature log reveals a different situation. Table 1 shows the temperature data that Rossi was looking at during the first 38 seconds of the video. There are no fluctuations at all on any of the readings. Rossi’s intense focus and subsequent adjustment were based on nothing.
Table 1
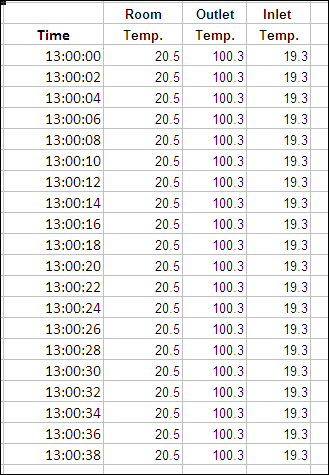
In fact, the logged temperature data casts doubt on all of Rossi’s adjustments, because it reveals that the temperatures remain constant for the majority of time during the demonstration. The only variation in the data is the temperature of boiling water in the outlet chamber of the device, which varies by no more than the limit of resolution of the sensor, +/-0.1C.
The temperature log reveals what Rossi is doing. He appears to be operating his device by monitoring changes in the readings. But the readings do not change.
Conclusion
Based on everything we know about the operation of Rossi's device, he has no reason except deception to adjust heater power during a demonstration.
Appendix 10 of New Energy Times ’ Report 3 proved that Rossi’s system is simple and his device is a prop. The report pointed out events in the video that left little doubt that Rossi perpetrated a hoax in the Ny Teknik video. However, the additional temperature log data, and the confirmed prediction that it led to, removes any doubt. |