Go to original
Science 8 March 2002:
Vol. 295. no. 5561, pp. 1868 - 1873
DOI: 10.1126/science.1067589
[Received] 31 October 2001; accepted 30 January 2002
Evidence for Nuclear Emissions During Acoustic Cavitation
R. P. Taleyarkhan,1* C. D. West,1 J. S. Cho,2 R. T. Lahey Jr.,3 R. I. Nigmatulin,4 R. C. Block3 J. S. Cho,2 R. T. Lahey Jr.,3 R. I. Nigmatulin,4 R. C. Block3
ABSTRACT
In cavitation experiments with deuterated acetone, tritium decay activity above background levels was detected. In addition, evidence for neutron emission near 2.5 million electron volts was also observed, as would be expected for deuterium-deuterium fusion. Control experiments with normal acetone did not result in tritium activity or neutron emissions. Hydrodynamic shock code simulations supported the observed data and indicated highly compressed, hot (106 to 107 kelvin) bubble implosion conditions, as required for nuclear fusion reactions.
1 Oak Ridge National Laboratory, Oak Ridge, TN 37831, USA.
2 Oak Ridge Associated Universities, Oak Ridge, TN 37830, USA.
3 Rensselaer Polytechnic Institute, Troy, NY 12180, USA.
4 Institute of Mechanics of Ufa-Bashkortostan Branch of the Russian Academy of Sciences, 6 Karl Marx Street, Ufa, 450 000, Russia.
* To whom correspondence should be addressed. E-mail: zrt@ornl.gov
Retired.
The intense implosive collapse of gas or vapor bubbles, including acoustically forced cavitation bubbles, can lead to ultrahigh compressions and temperatures and to the generation of light flashes attributed to sonoluminescence (SL) (1-21). Our aim was to study ultrahigh compression and temperatures in bubbles nucleated by means of fast neutrons, whereby bubble nucleation centers with an initial radius R0 of ~10 to 100 nm are created, and the bubbles grow in an acoustic field to a maximum radius (Rm) of ~ 1 mm (19) before an implosive collapse. This approach builds on the observations that (17) increasing Rm modestly (for example, by ~50%), or increasing the rate of collapse (16), can result in very large increases in peak gas temperatures and produce light emission during implosions. In contrast to single-bubble SL experiments, in which the initial bubble radius R0 typically increases to Rm by a factor of only ~10 (for example, from ~10 µm to ~100 µm), our neutron-induced nucleation technique results in Rm/R0 of ~105. For a spherical bubble, the increase of Rm/R0 by a factor of 104 implies a related volumetric ratio increase of 1012 over that produced by conventional techniques. Our expectation was that such an approach, with its vastly increased energy concentration potential during implosions, should give rise to significant increases in the peak temperatures within the imploding bubbles, possibly leading to fusion and detectable levels of nuclear particle emissions in suitable fluids.
To minimize the effect of gas cushioning by promoting rapid condensation during implosive collapse, we elected to work with highly degassed organic liquids. An organic liquid was chosen [normal acetone (C3H6O) as the control fluid and deuterated acetone (C3D6O) as the test fluid] because it permitted the attainment of large tensile states without premature cavitation, and thus a lot of liquid superheat would be present before nucleation. Organic liquids also have relatively large phase change coefficients, which is important, as described later. Unless otherwise noted, the liquid in the chamber was maintained at ~0°C (which was the lowest value obtainable with the equipment we used). The test liquid was degassed and subjected to an acoustic pressure field that oscillated in resonance with the liquid sample and its container. The nucleation of vapor bubbles was initiated with fast neutrons from an isotopic source (Pu-Be) or from a pulsed neutron generator (PNG) that produces 14-MeV neutrons on demand at a predefined phase of the acoustic pressure field.
Experimental system. In the experimental apparatus (Fig. 1), the test liquid was placed in an approximately cylindrical glass flask and driven acoustically with a lead-zirconate-titanate (PZT) piezoelectric driver ring attached to the outer surface. Either a plastic or a liquid scintillation detector was used for detection of neutron and gamma signals (22). The light was detected and amplified in a photomultiplier tube (PMT). A liquid scintillator (LS) detector-based system was set up for pulse-shape discrimination (PSD) (23, 24) [see Web Supplement 1 (25)]. The PSD circuit separates neutrons from gamma rays on the basis of differences in the PSD scintillator signal decay time between neutrons and gamma rays. The system could be operated to permit blocking of gamma rays (hereafter, a mode of operation referred to as "with PSD"). The net efficiency for fast neutron detection was estimated to be ~5 × 10 3 (26). 3 (26).
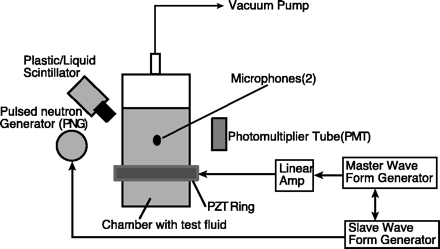
Fig. 1. Schematic of the experimental setup. The distance from the scintillator head to the PNG is ~15 cm; from the scintillator head to the chamber surface, ~0 to 2 cm; from the chamber center to the PNG, ~20 cm; and from the PMT to the chamber surface, ~5 cm. The system (the chamber, PNG, and PMT) is ~1.5 m above the floor. |
In the experimental sequence of events (Fig. 2), neutrons from the PNG nucleated vapor bubbles in the tensioned liquid when the cavitation threshold was exceeded at the time of the neutron burst. The nuclear radiation detector typically detected a pulse when the PNG was fired. Thereafter, the vapor bubbles grew until increasing pressure in the liquid during the second half of the acoustic cycle caused them to begin to collapse. If the implosion was robust enough, the bubble emitted a SL light flash, which could be detected by the PMT. In theory, if the liquid is composed of deuterium (D) and/or tritium (T) atoms, and the conditions are appropriate for D-D (or D-T) fusion, nuclear particles (neutrons and gamma rays) would be emitted and seen in the response from either the plastic scintillator (PS) or LS detector. Moreover, in cavitation experiments, when a bubble implodes, a pressure wave that travels at about the speed of sound in the test liquid is also generated and can be detected at the chamber walls by microphones. Significantly, our experiments were characterized by bubble dynamics within clouds of many bubbles.
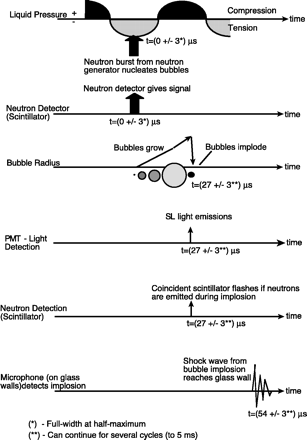
Fig. 2. Experimental sequence of events. |
Timing of key parameters. With our configuration of the PNG and electronic timing systems, we found, by analyzing the time spectrum of neutrons (25), that neutrons were emitted over a time span of ~12 µs [~4 to 6 µs at full width at half maximum (FWHM)], after which neutron counts were reduced considerably by 15 to 20 µs after the PNG fired (25). We initiated the PNG burst when the fluid tension state was greatest. For multiple-bubble implosions, several bubbles can implode and emit closely spaced SL flashes during any given cycle.
The time between a SL flash and the signals received at two microphones set up on diametrically opposite sides of our chamber was found to be ~27 µs, which is in agreement with the time for a shock wave to travel from the center of the chamber to the glass wall (about 32 mm away). This result indicates that the bubbles generally nucleated and imploded in or around the central axis of the test chamber (27). The efficiency of SL flash detection was dependent on the PMT bias voltage (which determines the gain) and the chosen discriminator settings (29).
Our data were obtained with a PZT drive amplitude much greater than that required for threshold nucleation. Because of this, and because the PNG pulse width was about 4 to 6 µs (FWHM), nucleation could occur a few microseconds before or after the minimum liquid pressure was reached. The timing of the SL flash relative to the PS pulse was analyzed with a multichannel analyzer (MCA). The PZT drive frequency was about 19.3 kHz, which corresponds to a full cycle time of about 52 µs. The time spectrum of events (25) confirmed that the PS flash corresponding to the PNG activation (lasting about 12 µs, with 4 to 6 µs FWHM) was followed by a SL flash (lasting about 4 to 6 µs FWHM) about 27 to 30 µs later.
Experimental observations for C3H6O and C3D6O. We conducted experiments with C3H6O (100% nominally pure) and C3D6O (certified 99.92 atom % D-acetone), filtered before use through 1-µm filters. Degassing was performed by applying a low pressure of about 10 kPa and acoustically cavitating the liquid for about 2 hours. To ensure continued robust nucleation growth and implosive collapse, the drive voltage to the PZT was set to be about double that needed for occasional cavitation (defined here as the occurrence of nucleation and collapse within a 10-s observation period). The negative pressure threshold for bubble nucleation by neutrons and alpha particles in acetone is -7 to -8 bar (20, 21). A pressure map of the chamber was obtained by means of a calibrated hydrophone. Using the scale factor for induced pressures in our chambers versus drive voltage to the PZTs, and gradually increasing the drive amplitude, we determined that the cavitation began at about -7 bar, which is consistent with the known value (20, 21). The pressure amplitude in our chamber was ~ ±15 bar (±220 pounds per square inch).
T detection, monitoring, and estimation. The D-D fusion reaction can have one of two outcomes that occur with almost equal probability. The first leads to the production of helium (He) and 2.5-MeV neutrons; the second to the production of T and protons. Therefore, in addition to the evidence collected for neutron or gamma ray activity, the formation of T would provide compelling evidence of D-D fusion.
To measure T activity, we sampled the experimental fluid directly with a scintillation counter calibrated for detecting T (28). Unless otherwise noted, experiments were conducted at ~0°C using 14-MeV neutrons generated at a rate of ~106 neutrons/s from the PNG spread over the specified time duration. When testing either C3H6O or C3D6O without cavitation (that is, with irradiation alone), we also used the same experimental configuration, including placing the chamber under standard vacuum conditions. In this way, we systematically conducted experiments, changing only one parameter at a time. The chamber was initially filled with C3H6O and irradiated for 7 hours without cavitation. A 1-cm3 liquid sample was withdrawn from fluid in the top region in the acoustic chamber and mixed with Ecolite and tested for T activity. Thereafter, cavitation experiments were performed for 7 hours. A 1-cm3 sample of C3H6O was again withdrawn and tested for T activity. This same process was later repeated for 12 hours.
After verifying the absence of T activity from the control tests with C3H6O, we repeated the experiments with C3D6O. The irradiation and cavitation experiments of 7 hours duration with C3H6O and C3D6O were repeated several times at ~0°C. A separate test was conducted over 5 hours, using a Pu-Be neutron source producing ~106 neutrons/s, to assess the influence of randomly produced neutrons.
Tests were also conducted to assess the impact of liquid temperature on T activity buildup by testing with C3D6O at ~22°C (room temperature). Finally, to assess the impact of the time of irradiation and cavitation on T buildup in C3D6O, testing was also conducted for 12 hours with PNG irradiation of ~106 neutrons/s at ~0°C.
Results of these experiments are summarized in Fig. 3, which includes values of standard deviation as well as background count rates. The data reveal no significant change in T activity for C3H6O with or without cavitation and irradiation. Under the same experimental conditions, irradiation alone of C3D6O samples with 14-MeV neutrons, or with neutrons from a Pu-Be source, did not result in any statistically significant change in T content. In contrast, in three separate 7-hour cavitation experiments with C3D6O at ~0°C and ~106 neutrons/s irradiation with the PNG, an average increase of 7.1 counts per minute (cpm) resulted. Similarly, two separate 12-hour experiments produced an average increase of 14.6 cpm, the increase being directly proportional, within statistical counting errors, to the increase in duration of the test. Overall, cavitation of C3D6O (at ~0°C with ~106 neutron/s PNG irradiation) over 7 hours resulted in increases of up to ~8.1 cpm [representing an individual difference of ~2.5 standard deviations (SD) and a collective change of ~4 SD], whereas cavitation and irradiation over 12 hours resulted in an average increase of ~14 cpm (representing an individual difference of more than 4.5 SD). Finally, cavitation of C3D6O (at ~22°C with ~106 neutrons/s PNG irradiation) over 7 hours did not result in any significant change in T activity. As will be described later, this agrees with the lack of SL activity at this higher temperature and is also consistent with the hydrodynamic shock code simulations to be discussed subsequently.
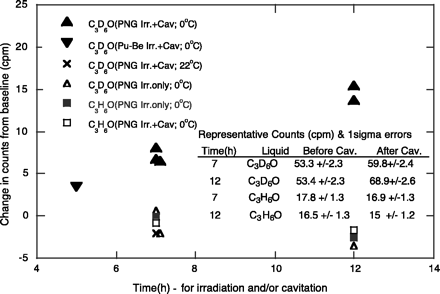
Fig. 3. T activity changes for C3D6O and C3H6O with irradiation (Irr.) and with irradiation plus cavitation (at 0°C). For C3D6O and C3H6O, 1 SD = ~3.5 cpm and ~2 cpm. PNG irradiation was at ~106 neutrons/s for specified time durations. All testing was conducted under the same configuration, placing the test cell under a vacuum of ~10 kPa.
|
If none of the T produced reacted with D atoms, an inverse calculation based on the observed T activity indicates that the D-D neutron production rate was ~ 7 × 10⁵ neutrons/s.
Neutron energy spectra data acquisition with PSD. We used PSD in experiments with and without cavitation to check for neutron production and to decipher the energy range in which significant increases in neutron counts occurred. Tests were conducted with the PSD system so that only neutron counts were accepted by the data acquisition system. For identical settings, it was verified that the PNG neutron output varied by ~ ±0.2% from measurement to measurement. Tests, with a PNG neutron output of ~106 neutrons/s, were conducted with C3H6O (as the control fluid) and with C3D6O for data acquisition times from 100 to 300 s, during which neutron counts were accumulated at the rate of ~500 counts/s. Changes in counts from the case without cavitation were evaluated in two energy ranges. The first covered the range between the lowest energy detectable and 2.5 MeV. The second was from 2.5 MeV upward (26). Representative results for the sample with C3D6O (that is, the increase in counts and the background counts) are shown in Fig. 4 for observations over 100 s in the two energy ranges. As shown, we observed a 4% increase in 2.5-MeV neutrons in these samples after the onset of cavitation. The variation in counts for the control liquid (C3H6O) was within ~0.2% in both energy ranges. These data were repeatable for 300-s acquisition times.
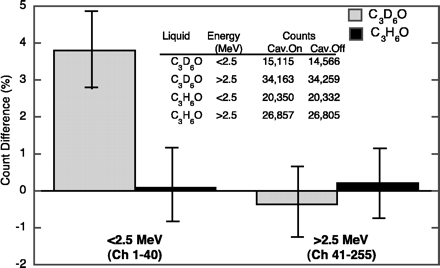
Fig. 4. Changes in counts for C3D6O and C3H6O with and without cavitation (Cav.). Error bars are 1 SD; data were taken over 100 s; and the percentage change in the <2.5-MeV range was found to be similar in magnitude for 300-s data acquisition times. |
Assuming Poisson statistics, 1 SD from a total population count varying from 50,000 to 150,000 ranges from ~0.4 to 0.25%. Therefore, a ~4% change in counts for a case with cavitation is a significant increase of ~4 SD above background. Because the data were repeatable, when taken as an aggregate, the average ~4% increase in counts represents a statistically significant change of >10 SD above background. For a ~4% increase in the case of C3D6O with cavitation (in the 2.5-MeV range), and using a distance-corrected detector efficiency (26), we estimate that the D-D neutron emission rate associated with cavitation was ~4 × 10⁴ to 8 × 10⁴ neutrons/s. This value is somewhat smaller than the estimated rate of neutron generation from the T measurements (~7 × 10⁵ neutrons/s). At least part of this difference can be attributed to uncertainties in detector efficiency, such as neutron energy losses by scattering in the test chamber or reduced detection efficiency for large-angle knock-ons from 2.5-MeV neutrons (25). There could also have been a nonuniform T distribution in the chamber after the cavitation experiments.
Coincidence data acquisition. We also looked at the coincidence between the SL and PS/LS pulses. Coincidence spectra were obtained by direct visual observations and manual recording of the individual coincidence signals on a digital storage oscilloscope triggered by the SL signal. Two different data acquisition modes (29) were tested. For mode 1 operation, at a low bias voltage for the PMT, it was conclusively determined that no false SL activity occurred during PNG operation, and that coincidence between SL and scintillator signals repeatedly took place for cavitated C3D6O at ~0°C but not for the control liquid. An example of data traces for tests with C3D6O showing coincidence between the SL flash and the scintillator pulse, and the subsequent microphone response, is shown in Fig. 5A. No such coincidence, followed by microphone traces, was seen for tests with the control liquid C3H6O. However, data acquisition with this mode of operation was slow, because many genuine SL signals were rejected as well. In the second mode of operation (mode 2), the bias voltage to the PMT was increased, resulting in some spurious SL signals generated during PNG operation (25, 29). However, this effect was easily accommodated by taking data with and without cavitation, leaving all other parameters the same, and then subtracting the coincidence data taken without cavitation from those taken with cavitation. Figure 5B displays typical coincidence data spectra taken in mode 2 of operation with C3D6O and C3H6O (30). Figure 5, C and D, display the actual counts with cavitation and background counts with PNG operation only. Data gathered in this mode were binned in 2-µs bins before and after the PMT signal. The experiments were repeated several times, with similar results. Coincidence data taken for each time bin were obtained with and without cavitation (keeping the PNG on in both cases). Counts taken without cavitation (that is, those that occurred during PNG operation, which were all random or false) were subtracted from counts taken with cavitation over the same recording interval. Only for tests with C3D6O at ~0°C, a sharp peak in net coincidences occurred in the 0- to 2-µs interval on either side of the PMT (SL) signal, after which the coincidence events tapered off to within 1 SD (29). No such peaking of coincidences was seen for the control fluid (C3H6O). Similar data for C3D6O were obtained at ~19° and ~21°C. At these temperatures, there was more evaporation and less condensation; as a result, the bubble collapse was less intense, and the number of coincidences was sharply reduced, as seen in Fig. 5B. The influence of random coincidences between SL and scintillator flash signals in the region of bubble collapse was estimated to be insignificant (30).
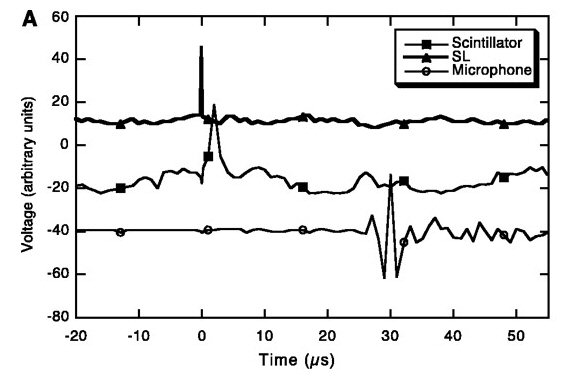
Fig. 5. (A) Representative time variation of PMT (SL) flashes, the scintillator nuclear signal, and microphone shock trace signals (C3D6O cavitation experiments at 0°C).
|
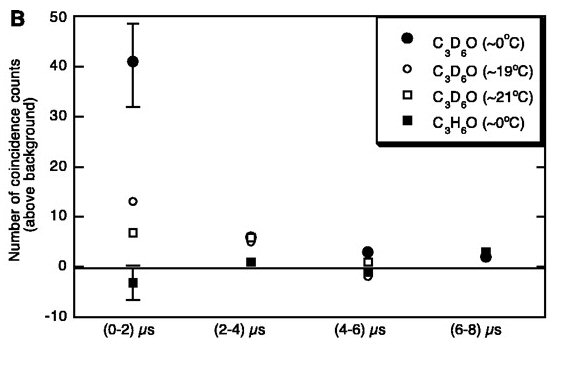
Fig. 5. (B) Coincidence data for C3D6O and C3H6O (mode 2 operation; PNG operation at ~106 neutrons/s at 200 Hz).
|
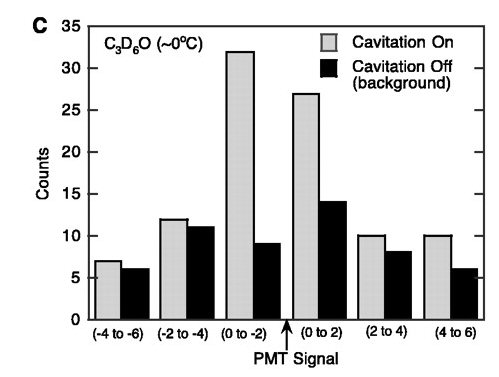
Fig. 5. (C) Coincidence spectrum data for C3D6O (mode 2 operation; PNG operation at ~106 neutrons/s at 200 Hz).
|
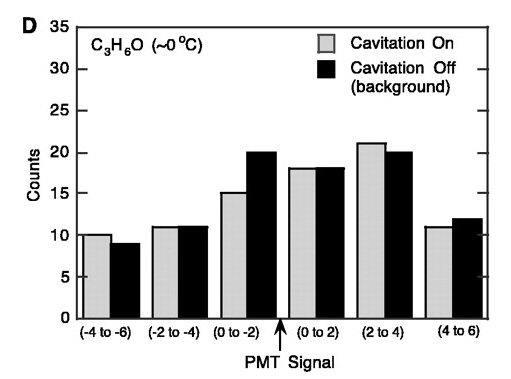
Fig. 5. (D) Coincidence spectrum data for C3H6O (mode 2 operation; PNG operation at ~106 neutrons/s at 200 Hz).
|
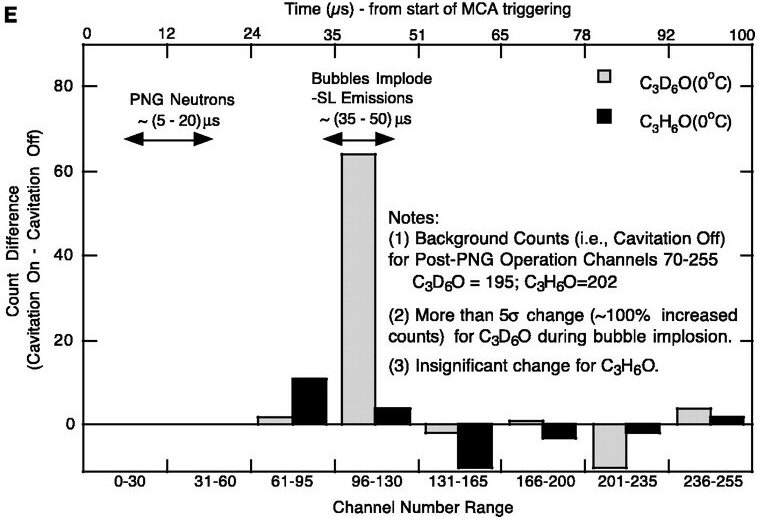
Fig. 5. (E) Time spectrum of nuclear emissions for deuterated and natural acetone [see Web Supplement 1 (25) for further details].
|
Results obtained with C3D6O, using MCA time spectrum data (Fig. 5E) and two different modes of data acquisition, show that PS or LS signals detecting penetrating nuclear radiation were coincident with the PMT signals detecting SL light emission during bubble implosion. Such data were not seen in the control tests with C3H6O.
Measurement of 2.5-MeV neutrons in this environment is difficult because of the background of 14-MeV pulsed neutrons and associated gamma rays from the PNG. Independent attempts to reproduce the neutron data using a different detection system and electronics yielded smaller neutron emission and no evidence for real coincidences between SL and neutron events (31). Indeed, in this independent experiment, the analysis of the singles count rates indicated that the coincidences observed may be random in nature. Additional analysis was done (32), but further measurements are required to understand the difference between these two sets of observations.
The analysis of bubble implosion. To obtain an estimate of the implosive collapse conditions and to help understand the observed experimental data trends, we developed a one-dimensional hydrodynamic shock (HYDRO) code [see Web Supplement 2 (25)] to numerically evaluate the conservation equations of each phase during bubble growth and collapse. This code includes the Mie-Gruniesen equations of state (33) and Born-Mayer potential functions (33), which are known to be valid for highly compressed fluids (34). In particular, for acetone these equations of state are based on the shock wave adiabat data of Trunin et al. (35), and they implicitly specify the effect of the induced radiation field and the dissociation and ionization processes that take place during plasma formation within imploding bubbles. Moreover, relevant energy losses and the effect of both molecular and electron/ion conductivity were taken into account, and the resultant HYDRO code [see Web Supplement 2 (25)] allowed for the evaluation of shock wave interaction using the well-established Godunov numerical technique.
Bubble dynamics were studied in C3D6O for conditions typical of those in our experiments. It was found that highly compressed conditions suitable for thermonuclear fusion were predicted, and, as can be seen in Fig. 6, the results were sensitive to the values of the phase change (that is, accommodation) coefficient,  , and the liquid pool temperature To. The reason why there is a strong sensitivity to To is that at low temperatures there is less evaporation and more condensation of the vapor during bubble expansion and compression, respectively, which in turn reduces the cushioning effect of the compressed vapor during implosions. Similarly, larger values of yield more condensation and thus more intense vapor compression. Interestingly, it is difficult to expose water (as opposed to organic fluids such as acetone) to large underpressures without having premature cavitation. Moreover, D2O has a relatively low value (36-38) of (~0.075) as compared to C3D6O, for which ~ 1.0 (39). Thus, C3D6O appears to be a better test fluid than heavy water. , and the liquid pool temperature To. The reason why there is a strong sensitivity to To is that at low temperatures there is less evaporation and more condensation of the vapor during bubble expansion and compression, respectively, which in turn reduces the cushioning effect of the compressed vapor during implosions. Similarly, larger values of yield more condensation and thus more intense vapor compression. Interestingly, it is difficult to expose water (as opposed to organic fluids such as acetone) to large underpressures without having premature cavitation. Moreover, D2O has a relatively low value (36-38) of (~0.075) as compared to C3D6O, for which ~ 1.0 (39). Thus, C3D6O appears to be a better test fluid than heavy water.
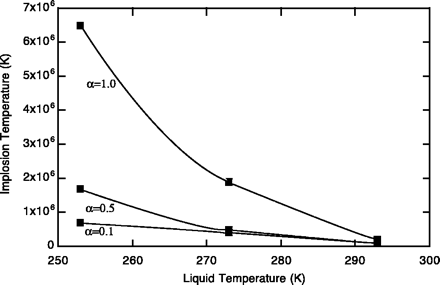
Fig. 6. Predicted variation of implosion gas temperatures with liquid pool temperature and phase change coefficient. Implosion gas temperatures are quoted for radial locations close to, but not at, the center of the bubble and correspond to the location where neutron production is a maximum [Web supplement 2 (25)]. The gas temperatures at the centerline can be much higher. |
To obtain an estimate of the D-D fusion neutron production rate, we may evaluate the fusion neutron kinetics equations and fusion cross sections (40, 41) over a range of uncertain parameters to arrive at reasonable estimates for the neutron production rate, varying from ~102 to 10 neutrons per implosion [see Web supplement 2 (25)]. Direct photographic evidence of the bubble clusters suggests that there were about 1000 bubbles in each bubble cluster in our experiments. Since up to 50 implosions/s were observed during our experiments, the HYDRO code (25, 42) predictions yielded neutron production rates ranging from about 103 to 106 neutrons/s, which is qualitatively consistent with the estimates from the T production rate, and the fusion neutrons measured in our experiments.
Many modeling assumptions were necessarily made in the HYDRO code, such as the equations of state, the use of an effective temperature to approximate the behavior of the electrons and ions in the plasma [Web supplement 2 (25)], the relevant energy losses, and various mechanisms for shock wave intensification (43, 44). In particular, a roughly 10-fold increase in the external driving pressure was used in the calculations (25, 42) to appropriately account for the effect of pressure intensification within the imploding bubble clusters. More realistic plasma physics, nuclear physics, and thermal-hydraulic models can and should be developed for future applications. Nevertheless, the predicted trends and basic physical phenomena that have been modeled agree with our experimental observations.
The observation of statistically significant T activity increases only in chilled (~0°C) cavitated C3D6O, coupled with evidence for neutron emissions in chilled cavitated C3D6O, and the absence of neutron emissions and T production in irradiated control tests with C3H6O, complemented by confirmatory modeling and HYDRO code simulations, suggest the possibility of D-D fusion during acoustic cavitation experiments with C3D6O (45).
REFERENCES AND NOTES
| 1. |
H. Frenzel and H. Schultes, Z. Phys. Chem. B 27, 421 (1934)
. |
| 2. |
B. Hahn and R. N. Peacock, Nuovo Cimento 27, 334 (1963)
. |
| 3. |
C. D. West and R. Howlett, Nature 215, 727 (1967)
. |
| 4. |
B. Barber, et al., Phys. Rev. Lett. 72, 1380 (1994)
[CrossRef] [ISI] [Medline]
. |
| 5. |
L. Crum, D. F. Gaitan, Frontiers of NonLinear Acoustics, 12th International Symposium on Nonlinear Acoustics (Elsevier Applied Science, New York, 1990).
|
| 6. |
L. Crum and T. Matula, Science 276, 1348 (1997)
[Full Text]
|
| 7. |
F. Gaitan, Physics World 12 (3), 20 (March 1999).
|
| 8. |
R. Hiller, S. Putterman, K. Weninger, Phys. Rev. Lett. 80, 1090 (1998)
[CrossRef]
. |
| 9. |
J. Kaiser, Sci. News 147 (17), 262 (1995).
|
| 10. |
D. Lohse, Nature 392, 21 (1998)
[CrossRef]
. |
| 11. |
W. B. McNamara III, Y. T. Didenko, K. S. Suslick, Nature 401, 772 (1999)
[CrossRef]
. |
| 12. |
H. Metcalf, Science 279, 1322 (1998)
[Full Text]
. |
| 13. |
W. Moss, D. Clarke, J. White, D. Young, Phys. Lett. A211, 69 (1996)
[CrossRef]
. |
| 14. |
R. Nigmatulin, R. T. Lahey Jr., NUREG/CP-0142 (Nuclear Regulatory Commission, Washington, DC, 1995).
|
| 15. |
Y. Tian, J. Kettering, R. Apfel, J. Acoust. Soc. Am. 100, 3976 (1996)
[CrossRef]
. |
| 16. |
F. Moraga, R. P. Taleyarkhan, F. J. Bonetto, R. T. Lahey Jr., Phys. Rev. 62, 2233 (2000)
[ISI]
. |
| 17. |
G. Delgadino, F. Bonetto, R. T. Lahey Jr., Chem. Eng. Commun., in press.
|
| 18. |
C. D. West and R. Howlett, Acoustica 21, 112 (1969)
. |
| 19. |
___, Br. J. Appl. Phys. 1, 247 (1968)
. |
| 20. |
B. Hahn, Nuovo Cimento 22, 650 (1961)
[ISI]
. |
| 21. |
D. Lieberman, Phys. Fluids 2, 466 (1959)
[CrossRef]
. |
| 22. |
The Bicron BC404 PS has dimensions of 5 cm by 2.5 cm; the Elscint LS has dimensions of 5 cm by 5 cm. The test cell (a Pyrex flask ~65 mm in diameter and ~200 cm high, with a PZT driver) was designed, fabricated, and set up at Oak Ridge National Laboratory (ORNL) for the experiments.
|
| 23. |
G. F. Knoll, Radiation Detection and Measurement (Wiley, New York, 1989).
|
| 24. |
J. H. Lee and C. S. Lee, Nucl. Instrum. Methods Phys. Res. A402, 147 (1998)
[CrossRef]
. |
| 25. |
Web supplements 1 and 2 are available on Science Online at www.sciencemag.org/cgi/content/full/295/5561/1868/DC1.
[Also at New Energy Times: Supplement 1 and Supplement 2.]
|
| 26. |
The 2.5-MeV proton recoil edge was determined by using cobalt-60 and cesium-137 monoenergetic gamma ray sources (24). For a 255-channel energy scale, the 2.5-MeV threshold was found to lie around channel 40, and the 14-MeV shoulder around channel 110. The efficiency of detection was determined to be ~ 5 × 10³ for a 2 × 10⁶ neutron/s Pu-Be isotope source positioned near the face of the LS detector. This efficiency, corrected for the actual distance (~5 to 7 cm) of the LS detector from the cavitation region, gives an estimated efficiency of ~ 1 to 2 × 10⁴.
|
| 27. |
Microphones were attached to the outside of the flask on diametrically opposite sides. The frequency of bubble-burst generation varied from ~15 to 35 or more bursts/s, depending on the state of tuning. Shock traces from individual bubble bursts lasted for ~5 ms.
|
| 28. |
A Beckman LS6500 scintillation counter, calibrated to detect 5- to 18-keV beta ray decays from T, was used.
|
| 29. |
SL detection with the PMT (a Hammamatsu R212 with 2-ns rise time) varied strongly with the bias voltage. At -300 V, about one SL flash every 10 s was detected, whereas about one to five SL flashes/s were detected at a -450-V bias. The PNG operation caused pseudo SL flashes to occur during the time of neutron production only with -450-V bias voltage; the time spectrum (25) of SL flashes indicated that about 30% of the recorded SL flashes occurred during PNG operation.
|
| 30. |
The acoustic chamber was a high-Q system and as such required continuous tuning for optimal performance and bubble implosion occurrence. Time to obtain 100 coincidence data points as shown in Fig. 5B averaged about 30 min. Standard deviation was computed by taking the square root of the sum of the counts in each time bin. From the MCA time spectrum, we calculate an instantaneous rate of ~ 1 to 50 neutrons and gamma rays per second during the time of bubble implosion and SL light emission. For a 20-µs time window, and a rate of about one SL flash/s for a coincidence gathering time of ~1600 s, the number of random coincidences was calculated to be negligible [(20 × 106) × (1 to 50) × 1 × 1600 ~ (0.03 to 1.6)]. In mode 2 operation, data were obtained on a two-channel 500-MHz scope. Simultaneous time spectra data were not possible to obtain for SL and scintillator signals. These were obtained separately with an MCA (25) under identical mode 2 coincidence experimental conditions and revealed insignificant deviation from run to run. These data were then used to estimate random coincidences. It was determined that coincidences occurring during the time of PNG operation would all be random. However, as discussed earlier in this note, the random coincidences during bubble implosion appear to be insignificant.
|
| 31. |
D. Shapira, M. J. Saltmarsh, "Comments on the Possible Observation of D-D Fusion in Sonoluminescence" (2002) (http://www.ornl.gov/slsite).
[Also on New Energy Times: "Comments on Possible..."]
|
| 32. |
R. P. Taleyarkhan, R. C. Block, C. West, R. T. Lahey Jr., "Comments on the Shapira/Saltmarsh Report" (31) (http://www.rpi.edu/~laheyr/SciencePaper.pdf).
[Also on New Energy Times: "Comments on S/S Report"]
|
| 33. |
Y. B. Zeldovich, Y. P. Raizer, Physics of Shock Waves and High Temperature Hydrodynamics Phenomena (Academic Press, New York, vols. 1 and 2, 1966).
|
| 34. |
R. Nigmatulin, Dynamics of Multiphase Media (Hemisphere, vol. 1, 1991), p. 244.
|
| 35. |
R. F. Trunin, et al., Khimiche Skaya Fizika 11, 424 (1992)
. |
| 36. |
I. S. Akhatov, et al., Phys. Fluids 13, 2805 (2001)
[CrossRef]
. |
| 37. |
N. Chodes, J. Warner, A. Gagin, J. Atmos. Sci. 31, 1351 (1974)
[CrossRef]
. |
| 38. |
D. E. Hagen, et al., J. Atmos. Sci. 46, 803 (1989)
[CrossRef]
. |
| 39. |
B. Paul, Raketnaya Technika 9, 3 (1962)
. |
| 40. |
R. A. Gross, Fusion Energy (Wiley, New York, 1984).
|
| 41. |
H. S. Bosch and G. M. Hale, Nucl. Fusion 32, 611 (1992)
[CrossRef]
. |
| 42. |
R. T. Lahey Jr., R. I. Nigmatulin, R. P. Taleyarkhan, in Proceedings of the 3rd International Conference on Transport Phenomena in Multiphase Systems (HEAT-2002), Kielce, Poland, 24 to 27 June 2002, in press.
|
| 43. |
Y. Tomita and A. Shima, Acoustica 71, 161 (1990)
. |
| 44. |
I. S. Akhatov, V. A. Baikov, R. A. Baikov, Fluid Dyn. 21, July, 161 (1986).
|
| 45. |
Sponsorship of this research by the U.S. Defense Advanced Research Projects Agency is gratefully acknowledged. We thank D. Steiner of Rensselaer Polytechnic Institute and D. Shapira of ORNL for critical reviews and valuable feedback with constructive comments. We also wish to acknowledge the efforts made by the staff of the Baskortostan Branch of the Russian Academy of Sciences regarding the HYDRO code simulations; in particular, I. Akhatov, R. Bolotnova, N. Vakhitova, A. Topolnikov, and K. Zakirov. |
(In accordance with Title 17, Section 107, of the U.S. Code, this material
is distributed without profit to those who have expressed a prior interest
in receiving the included information for research and educational
purposes. New Energy Times has no affiliation whatsoever with the
originator of the original text in this article; nor is New Energy Times
endorsed or sponsored by the originator.)
"Go to Original" links are provided as a convenience to our readers and allow for verification of authenticity. However, as originating pages are often updated by their originating host sites, the versions posted on New Energy Times may not match the versions our readers view when clicking the "Go to Original" links.
|