3/18: Due to the rainfall overnight and throughout the day, we expect an amount of "scrubbing" of the atmosphere as particles attach to rain drops. We have collected many liters of rainwater and are currently shifting our focus to sampling and testing the rainwater. Rainwater samples taken today will be counted overnight with results to be posted tomorrow morning. In addition, we are increasing our flow rate for air sampling and will not post air sampling results until Sunday night. However, due to the expected moderate levels of precipitation over the weekend we expect greater sensitivity within the rainwater samples.
3/17 20:00 - 3/18 10:00: No detectable counts from radionuclides of interest above background.
3/17 09:00 - 3/17 20:00: No detectable counts from radionuclides of interest above background.
3/16 18:00 - 3/18 09:00: No detectable counts from radionuclides of interest above background.
| Start |
End |
Air Vol. (m3) |
K-40 (cph*) |
I-131 (cph*) |
Cs-137 (cph*) |
Te-132 (cph*) |
Data |
| 03/16 1800 |
3/17 0900 |
0.63 |
28.2 +/- 2.2 |
-1.31 +/- 0.99 |
-0.48 +/- 1.26 |
0.30 +/- 1.36 |
data |
| 03/17 0900 |
3/17 2000 |
0.39 |
26.1 +/- 1.40 |
-0.49 +/- 0.84 |
0.53 +/- 1.04 |
-0.14 +/- 1.05 |
data |
| 03/17 2000 |
3/18 1000 |
0.59 |
30.3 +/- 1.90 |
0.12 +/- 0.99 |
-1.01 +/- 1.11 |
-1.18 +/- 1.15 |
data |
* cph = radiation counts per hour in detector. Note: K-40 is natural background for reference.
Note: Negative numbers indicate statistical fluctuations below the background baseline measurement. These can be interpreted as zero.
The UC Berkeley Department of Nuclear Engineering is currently performing measurements to detect a potential increase in radiation here in Berkeley that could be associated with the release of radioactive materials in Japan. We perform this measurement by sampling air flowing through a particle filter mounted at the top of Etcheverry Hall. We first calibrated the monitor to account for normal background radiation levels. After a period of 8-12 hours of particle collection, we take the filter down to our counting station in our laboratory and, using highly sensitive detection instruments, can determine the concentration of target radioactive elements within the air sample collected by counting gamma-ray photons emitted. This is to determine if any radiation signatures are present above normal background radiation levels.
The detection instruments we are using are not only able to measure the amount of radiation in the sample, but also its energy. More specifically, we measure gamma rays and their energies in our detector, which provides a unique fingerprint of a specific radioisotope. By measuring the energy of the gamma rays with high precision, we can not only determine the amount of radiation due to a specific radioisotope, but we can distinguish it from the natural background radiation we measure as well.
For example, we can measure gamma rays from isotopes of Cesium (Cs) such as Cs-134 or Cs-137, Iodine (e.g. I-131), or Tellurium (e.g. Te-132), which we would expect to see from the release due to the fission products in Japan.
It is important to realize that all because we can detect radiation does not mean it is harmful. Our instruments are so sensitive that we can measure radiation far below the levels of the natural background radiation we live in day to day. For example, even if we are able to observe a tens of counts per hour of I-131 or Cs-137, we have to compare that to a natural background radiation level of > 300000 counts per hour when expressed in these terms. Therefore, even if we were able to observe these small amounts of radiation, it will only lead to a very small increase in the radiation we are exposed to due to the natural radiation and will have no measurable health effect.
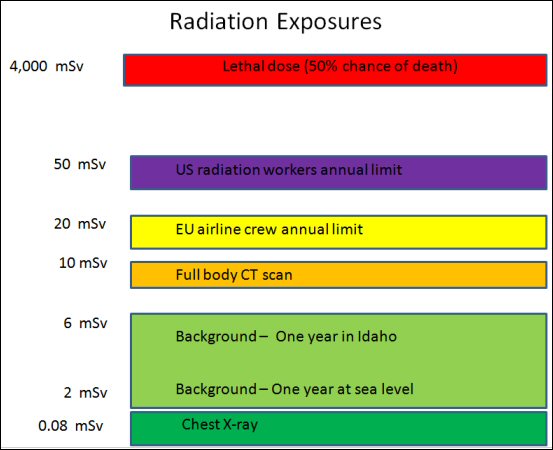
We express the biological effect of radiation in terms of doses and dose rates expressed for example in terms of millirem (mrem) or milli-Sievert (mSv) per hour, day, or year. One millisievert is equivalent to 100 millirems. The average dose of a person living in the U.S. is about 620 mrem (6.2 mSv) per year. This can be broken down into about 300 mrem per year due to natural background, such as radon and ultraviolet rays from the sun, and 320 mrem per year due to artificial exposures, such as X-rays or Computed Tomography (CT) scans. One Chest-CT scan produces about a 1,000 mrem dose of radiation exposure, or about three times the level due to just the natural exposure. The radiation levels we expect to measure due to the events in Japan will be 1,000 times smaller than the natural levels of background radiation.
Source: MIT NSE Nuclear Information Hub
The maximum measured dose rate at the Fukushima plant has been reported at 11.4 mSv/hr (source and plots) which puts the dose in one hour to be near a full-body CT scan and one-fifth the annual US dose limit for US radiation workers. No health effects have been proven below the 50mSv per year level.
We began the air sampling at 6pm, Wednesday March 16, 2011 and moved the filter to our counting lab at 9 a.m. Thursday, March 17. The chart above presents our first and preliminary results.
The "data" link for each measurement leads to a so-called energy spectrum obtained with our detector, which is a high-purity germanium semiconductor detector. Indicated are features and lines reflecting background radiation from primordial materials such as potassium, thorium and uranium. The number of counts within the various peak regions will be tabulated and compared to normal background to determine if the filter paper contains radioactive materials. What is also indicated are regions where we expect to see specific lines from materials and specific radioisotopes that could be associated with the release of radioactive materials in Japan.
Description of Experimental Setup
|