ABSTRACT
Time spectra of neutron and sonoluminescence emissions were measured in cavitation experiments with
chilled deuterated acetone. Statistically significant neutron and gamma ray emissions were measured with a
calibrated liquid-scintillation detector, and sonoluminescence emissions were measured with a photomultiplier
tube. The neutron and sonoluminescence emissions were found to be time correlated over the time of significant
bubble cluster dynamics. The neutron emission energy was less than 2.5 MeV and the neutron emission
rate was up to ~4x10^5 n/s. Measurements of tritium production were also performed and these data implied
a neutron emission rate due to D-D fusion which agreed with what was measured. In contrast, control experiments
using normal acetone did not result in statistically significant tritium activity, or neutron or gamma ray
emissions.
INTRODUCTION
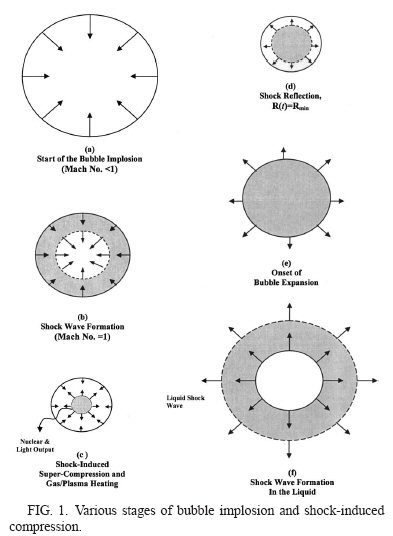
The intense implosive collapse of bubbles, including acoustic cavitation bubbles, can lead to extremely high compressions and temperatures, and to the generation of light flashes attributed to sonoluminescence ~SL!. The modeling and analyses of the basic physical phenomena associated with such a process have been discussed elsewhere [1 and the key phenomena are depicted schematically in Fig. 1. Figure 1(a) shows the start of bubble implosion, during the compression phase of the impressed acoustic pressure field, when the gas/vapor Mach number is much less than unity. As the interfacial Mach number approaches unity a compression shock wave is formed in the gas/vapor mixture and, as shown schematically in Fig. 1(b), this shock wave (dashed line) moves toward the center of the bubble and, in doing so, intensifies. Figure 1(c) shows the situation just after the shock wave has bounced off itself at the center of the bubble which highly compresses and heats a small core region near the center of the bubble. At this point we normally have a SL light pulse, and if we have a suitable (e.g., deuterated) liquid in which the bubble temperatures, density and their duration are large enough, we may also have conditions suitable for nuclear emissions (i.e., nuclear fusion). Interestingly, these emissions and the pressurization process continue until a short time later when the interface comes to rest [see Fig. 1(d)]. Figure 1(e) shows the onset of bubble expansion during the rarefaction phase of the impressed acoustic pressure field, and Fig. 1(f) shows that a relatively weak shock wave is formed in the liquid surrounding the bubble during bubble expansion. As will be described later, for sufficiently violent implosions of relatively large bubbles this shock wave is normally heard by the experimenters after it reaches the wall of the test section in which the experiment is being performed
Our aim was to study the ultrahigh compression effects and temperatures in vapor bubbles nucleated in highlytensioned liquids by means of fast neutrons, whereby the bubble radius increases from an initial radius (R0) of tens of nanometers to a maximum radius (Rm) in the millimeter range. This results in a related volumetric expansion ratio which is huge [1] compared to that obtainable in conventional SL experiments (where Rm ~10R0).
|
Such an approach,with its vastly increased energy concentration potential
during implosions, gives rise to very much higher peak
temperatures and densities within the imploding bubbles,
possibly leading to DD fusion and detectable levels of
nuclear particle emissions in suitable deuterated liquids. Indeed,
we have previously presented evidence [1] for neutron
emission and tritium production during cavitation experiments
with chilled deuterated acetone.
Comments received [2–6] on the previously published results
[1] suggested the need for improved instrumentation
and data gathering; for enhancing our understanding of the
timing and rates of neutron and gamma ray emission activity;
for improving the efficiency for the detection of neutron
emissions during bubble implosions; and for addressing the
potential for significant chemical effects from cavitation in
the tritium measurements. Specifically, in the data resented
previously [1], time spectra were obtained only for the period
corresponding to the first implosion of the nucleated
bubbles. In this paper, we report results of investigations
using improved and additional instrumentation. These additional
data fully support our previous results and provide
complementary evidence of nuclear emissions from cavitating
chilled deuterated acetone that are indicative of
deuterium-deuterium (DD) fusion.
EXPERIMENTAL SYSTEM
The experimental test apparatus [Fig. 2(a)] was kept similar
to that used for the results reported previously [1]. The
test liquid was placed in an approximately cylindrical Pyrex
glass test section and driven acoustically with a leadzirconate-
titanate (PZT) piezoelectric driver ring attached to
the outside surface of the test section. This induced an acoustic
standing wave in the test section with a pressure antinode
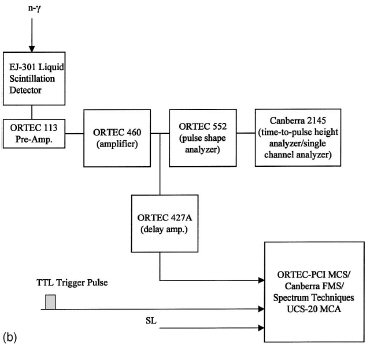
of amplitude ~+/-15 bar. A new liquid scintillator (LS) detection
system was set up for pulse-shape discrimination (PSD), and was used for the detection of neutron and gamma
ray signals with the instrumentation shown in Fig. 2(b). As
compared to the data acquisition system used earlier [1], the
new system [7] includes fast multichannel scaling (MCS)
capability that could be used to obtain time spectra of the
neutron and SL signals over the entire time span of experimentation.
A multichannel analyzer (MCA), operated in the
pulse height mode, was used to obtain pulse height data with
and without gating, and also for gating of gamma ray signals.
In the experimentally observed sequence of events [Fig.
2(c)], neutrons from a pulse neutron generator (PNG) nucleated
bubbles in the tensioned liquid when the cavitation
threshold was exceeded at the time of the PNG neutron burst.
Thereafter, the vapor bubbles grew until increasing pressure
in the liquid during the second half of the acoustic cycle
caused them to collapse. If the collapse was robust enough(~i.e., an implosion occurred), the bubble emitted a SL flash
which was detected by a photomultiplier tube (PMT) [7]. If
the vapor contains sufficient deuterium (D) atoms, and the
conditions are appropriate for DD fusion, nuclear particles (neutrons and gamma rays) would be emitted and seen in the
response of the LS detector. Subsequent to the first implosion the bubble cloud may undergo periodic growth and
energetic collapses at the 19.3 kHz frequency of the forcing
acoustic pressure field. This process is repeated until the
bubbles condense, and there can be neutron and gamma ray
emissions during the subsequent implosions, however, the
yield can differ from that during the initial implosion. Shown
in Fig. 2(d) are typical photographic images of bubble clouds
taken 1 ms apart in acetone at ~3 °C. It is seen that the
bubble clouds persist in the pressure antinode of the test
section for ~5 ms prior to condensing, and reach bubble
cloud sizes in the range of ~6 mm in diameter.
The liquid was first degassed, as reported on previously[1], by acoustically cavitating the liquid under vacuum
(~10 kPa) with neutrons for ~2 h. This process is important
since gassy vapor bubbles do not exhibit the desired
intense implosive collapse characteristics as clearly evidenced
from shock traces measured by microphone signals.
Subsequent to degassing the liquid, the PNG was operated at ~;200 Hz (i.e., at a rate 100 times smaller than the acoustic
driving frequency) during which neutrons were emitted over
a time span of ~15 ms [6–7 ms full width at half maximum
(FWHM)]. The PNG burst was initiated when the liquid
tension was greatest (i.e., at 215 bar). For these conditions
a bubble cloud was formed and rapidly expanded.
Later, when the impressed acoustic pressure increases, it imploded
emitting a burst of closely spaced SL flashes over an
~15– 20 ms time interval (each of ~5 ms duration).
LIQUID SCINTILLATION (LS) DETECTOR
CALIBRATION
Careful calibration of the response of the LS detector was
conducted using gamma rays from Cs-137 and Co-60 sources, 14 MeV neutrons from a PNG, and emissions from
a plutonium-beryllium (Pu-Be) isotope source. The results of
these calibrations are shown in Fig. 3(a). The pulse height
spectra for Cs-137 and Co-60 are also shown on a stretched
scale in the lower plot; a relatively sharp Compton edge
results from the monoenergetic ~0.67 MeV gamma ray
emission from Cs-137, whereas, a somewhat broader edge
results for Co-60 due to the two closely-spaced 1.17 and 1.33
MeV gamma rays. Note also that the Pu-Be source exhibited
the well-known 4.4 MeV Compton edge associated with the
deexcitation 12C* gamma ray. The pulse height response of
the LS detector matched the well accepted light output for
EJ-301/NE-213 type detectors [8,9]. The ~2.5 MeV proton
recoil edge is known [10] to lie between the Compton edges
for gamma rays from Cs-137 and Co-60. Moreover, the ratio
of light output for 14 MeV neutrons to that for 2.5 MeV
neutrons was found to be ~11.7 as expected [10]. Using a
Pu-Be source with a known neutron emission rate, the net
efficiency for the detection of fast (mainly <4 MeV) neutrons
was estimated [11] to be ~6x10^-4. Figure 3(b) displays
time spectra of gamma and neutron signals with and
without pulse shape discrimination (PSD). For PSD the discriminator
settings were chosen to reject more than 95% of the gamma rays. As expected [9], the fractional counts associated
with the gamma rays was found to be ~45% of the
total counts in the time spectrum for the Pu-Be source. In
addition, the LS detector was carefully calibrated with monoenergetic
neutrons at the RPI LINAC, and these calibrations
agreed very well with the in situ ORNL calibrations
discussed above.
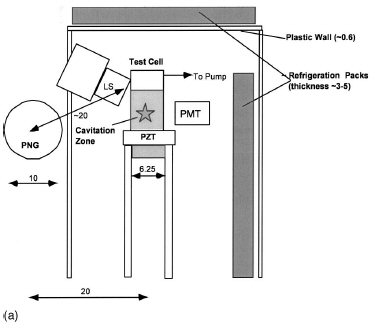 
Figures 2(a) and (b)
FIG. 2. (a) Schematic arrangement of test chamber and key components [Notes: (1) All dimensions are in cm; (2) acronyms: LS (liquid
scintillation detector); PNG (pulse neutron generator); PMT (photomultiplier tube for SL detection); (3) borated shield blocks, furniture, etc.
not shown]. (b) Sample layout of electronic components for pulse-shape discrimination and time spectra data acquisition. |
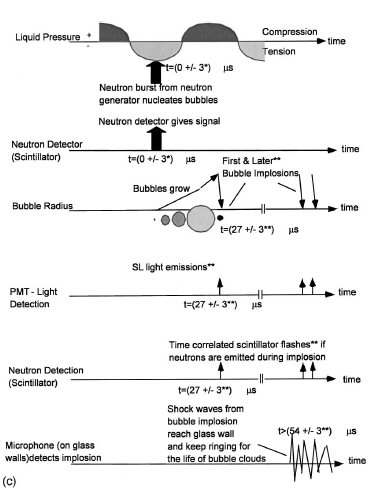
Figure 2(c) Time sequence
of events. (*) Full width at half maximum; (**) can continue for several cycles (to ~5ms at 0 °C).
|
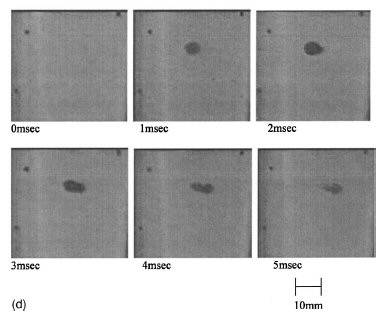
Figure 2(d) Images of bubble cloud nucleation
to collapse for tests with C3H6O (3 °C). (Images taken at rate of 1000 frames per second and 1/2000 second shutter speed.)
|
EXPERIMENTAL OBSERVATIONS FOR
C3H6O AND C3D6O
We conducted experiments with standard acetone, C3H6O (100 atom% pure), and deuterated acetone, C3D6O (certified
99.92 atom% D-acetone), filtered before use through 1 mm
filters. Degassing and other aspects of the forcing pressure
amplitude were kept the same as for the conditions reported previously [1]. The pressure amplitude at the acoustic pressure
antinode in our test section was maintained at a nominal
value of ~+/-15 bar.
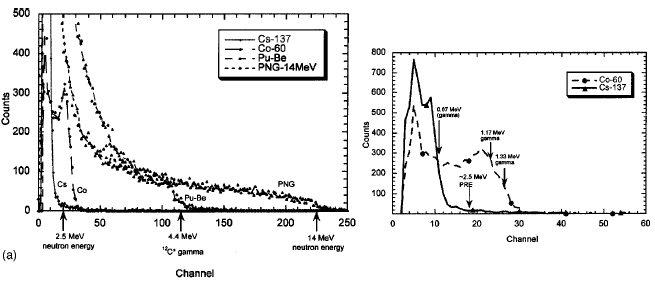
FIG. 3. (a) LS detector pulse height spectra.
|
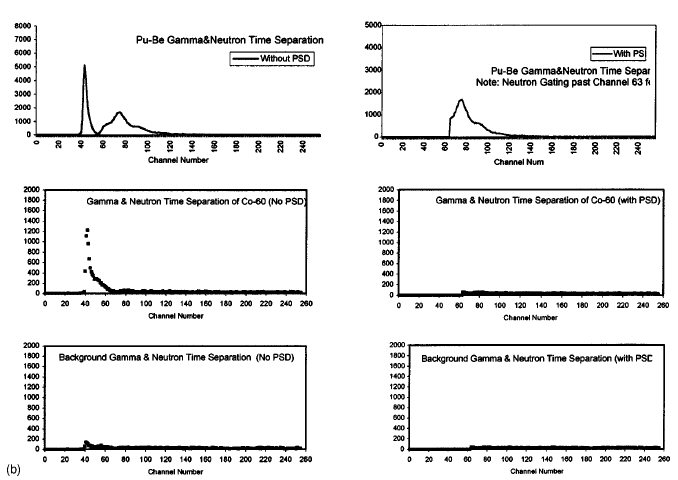
FIG. 3. (b) Time-spectra data with and without PSD for Pu-Be source, Co-60 monoenergetic gamma
source, and background. For Pu-Be source the gamma ray fraction is ~40% of the total counts obtained.
|
NEUTRON AND SL SPECTRA DATA ACQUISITION
We used well-established pulse shape discrimination (PSD) techniques in experiments with and without cavitation
to check for neutron production and time correlations with
SL emission data. Time spectra were obtained using 1000
channel MCS boards with 5 ms dwell times, such that the
neutron counts during PNG operation, which occur within
the first 25 ms after the trigger signal is transmitted to the PNG, are well separated from the signals during ubsequent
events all the way to 5000 ms, which is just before the next
PNG trigger pulse was transmitted. It was verified that, for
identical settings without cavitation, the collective PNG neutron
output of counts over 50 s duration was stable and varied
by only ~+/-1% from measurement to measurement.
Time spectra data were collected and statistically significant
counts were obtained. Representative neutron and SL time
spectra are shown in Figs. 4 through 7.
Figure 4 shows the MCS cumulative neutron count spectra
vs time after the PNG fires for tests with C3D6O. These
spectra were accumulated for 10 000 sweeps, each of 5 ms
duration. Figure 4(a) is with cavitation while Fig. 4(b) is without. It can be seen that excess neutrons were only detected
when there were cavitation bubbles. It is interesting to
note in Figs. 4(a) and 7(a) that there is a significant peak
during the implosion associated with the first sonic cycle of
period 52 ms, which occurs about 20 ms after the PNG neutrons
emanate, and then there appears a time span of low neutron counts extending to channel ~100 (~500 ms)
which is ~10 acoustic cycles. Starting at channel ~100 (500 ms) the neutron counts start to grow significantly
to a peak near channel ~180 (~900 ms) and then asymptotically
decrease to a lower level around channel
~500 (2 500 ms), reaching values about 10 times smaller than in the peak channels. In comparison, the non-cavitation
spectrum shown in Fig. 49(b), which was obtained by shifting
the phase of the PZT driver, showed a peak lasting ~15 ms
from the PNG source neutrons followed by rapidly decreasing
neutron counts to a relatively constant background level
which persisted out to the end of the sweep at channel 1000
(5 ms). It should be noted that these data trends are consistent
with previously reported experimental observations(www.rpi.edu/;laheyr/SciencePaper.pdf).
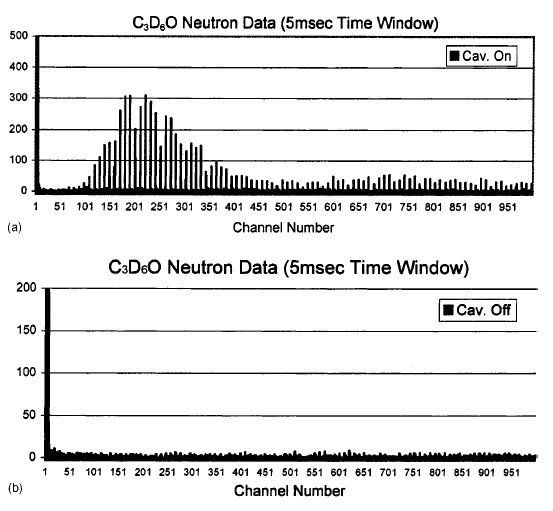
FIG. 4. (a) Time spectrum of
neutron counts for tests with cavitation
on (C3D6O at 0 °C; PNG
drive frequency ~200 Hz; acoustic
forcing frequency =~19.3
kHz; time channel width 55 ms). (b) Time spectrum of neutron
counts for tests with cavitation off
(C3D6O at 0 °C; PNG drive frequency ~;200 Hz; PZT drive left on but frequency phase shifted to prevent cavitation; time channel width=5 ms).
|
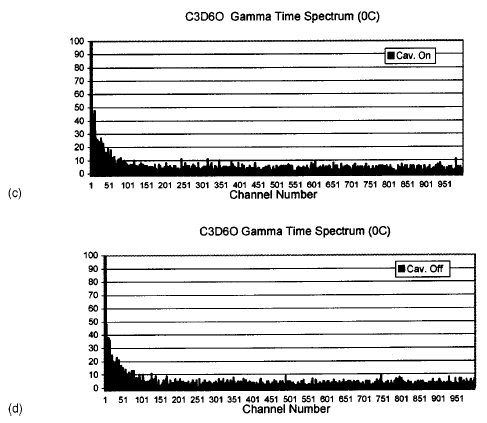
FIG. 4. (c) Time spectrum
of gamma ray counts for tests with
cavitation on (C3D6O at 0 °C;
PNG drive frequency ~200 Hz;
acoustic forcing frequency =~19.3 kHz; time channel width
=5 ms). (d) Time spectrum of
gamma ray counts for tests with
cavitation off (C3D6O at 0 °C;
PNG drive frequency ;200 Hz;
PZT drive left on but frequency
phase shifted to prevent cavitation;
time channel width =5 ms).
|
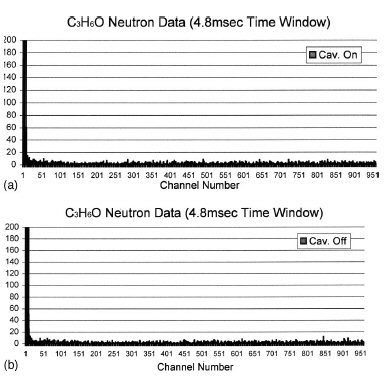
FIG. 5.(a) Time spectrum of neutron counts for tests with cavitation
on (C3H6O at 0 °C; PNG drive frequency ~200 Hz; acoustic
forcing frequency =~20.3 kHz; time channel width=5 ms). (b)
Time spectrum of neutron counts for tests with cavitation off
(C3H6O at 0 °C; PNG drive frequency ~200 Hz; PZT drive left on
but frequency phase shifted to prevent cavitation onset; time channel
width =55 ms).
|
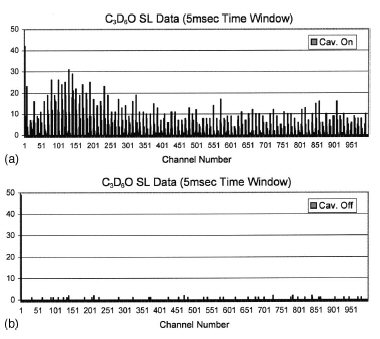
FIG. 6. (a) Typical SL time spectra with cavitation on (C3D6O
at 0 °C; PNG drive frequency ~200 Hz; acoustic forcing
frequency =~19.3 kHz; time channel width =5 ms). (b) Typical SL
time spectra with cavitation off (C3D6O at 0 °C; PNG drive frequency
~200 Hz; PZT drive left on but frequency phase shifted to
prevent cavitation; time channel width =5 ms).
|
We interpret the spectrum of Fig. 4(a) as cavitation induced
neutron production from D-D reactions in the periodically
imploding bubble cloud. On the other hand, the noncavitation
spectrum of Fig. 49b) shows the PNG source
neutron peak followed by a rapidly decaying counting rate to
channel ~10 (~50 ms); this decaying count rate is attributed
to neutron capture of the PNG source neutrons and possibly
the ~5% of gamma rays which may also be counted
when the LS detector is operated in the PSD mode. It is also
worth noting that the counting rate in Fig. 4(a) from channels ~500 to 1000 remains greater than the background counts in
the corresponding region of Fig. 4(b); we interpret this as a
small amount of cavitation-induced neutrons from the periodically
imploding bubble cloud.
Figures 4(c) and 4(d) present the corresponding time
spectra for the cases of cavitation on and off with gating on
gamma rays (i.e., we rejected the counts associated with neutrons).
As noted therein, the emission spectra do not display
the trends observed for neutrons and provide confidence that
the spectrum presented in Figs. 4(a) and 4(b) are quite distinct
and represent neutron emissions. The aspect of gamma ray counts with and without cavitation for deuterated and
natural acetone is covered in greater detail in a later section.
As can be seen in Fig. 7(a), the increase of counts (at an
overall rate of up to ~250 cps) starts about 30 ms after PNG
neutron emanation (i.e., during the initial implosion of the
bubble cloud which was formed) and the cumulative number
of counts, between a 30 ms to 5000 ms time span, was found
to be comparable to the counts collected during PNG firing;
these counts during bubble implosion varied from run to run
between a factor of ~0.3 to ~1.5 times the total number of
neutron counts that were measured for in ~15 ms time bins
corresponding to PNG firing, and, as such, they provide an
additional useful benchmark for estimating the neutron emission
rate due to bubble implosion in C3D6O. The counts
during PNG neutron emission were essentially constant from
run to run (i.e., well within 1 SD). Assuming Poisson statistics,
the change in counts with cavitation that were recorded
after PNG operation, for tests with chilled C3D6O, represents
a very significant increase of more than 60 SD’s [13]
above background. Figures 5(a) and 5(b) show, respectively,
the neutron count spectrum for the control liquid C3H6O
with and without cavitation. These spectra are very similar to
Fig. 4(b) and show no evidence of cavitation-induced neutron
production.
Figures 6 display representative results for the sonoluminescence
(SL) emission spectrum using C3D6O; the spectrum
for C3H6O was found to be similar. As expected, there
were no significant SL emission signals unless cavitation
bubble implosions took place. Interestingly, however, unlike
in Fig. 4(a), there is not a large ‘‘dead time’’ evident in Fig.
6(a). This indicates that the implosions for the first ten or so
acoustic cycles after the bubble cloud implosion were not
energetic or numerous enough to induce significant DD fusion, but were able to produce SL light flashes. A plot (for
the first 100 ms) of the results for neutron and SL activity is
shown in Figs. 7(a) and 7(b), respectively. The time correlation
of the neutron and SL emissions is evident during the initial implosion of the bubble cloud. A composite plot of the
raw neutron and SL data with cavitation off and cavitation on
over the entire 5000 ms sweep time is shown in Fig. 7(c).
The strong time correlation between neutron and SL emissions is evident. This is also seen with binning in Figs. 7(d)
and 7(e) that, in the time interval 0.5 ms to 2.0 ms, the SL
emissions are also strongly time-correlated with neutron
emissions, a result which indicates that D-D neutron emissions,
subsequent to the initial neutron-induced bubble
nucleation in chilled C3D6O, also occur during subsequent,
sufficiently energetic, bubble cloud implosions. The binning
process used is depicted in the accompanying table to Fig.
7(d0. Figure 7(e) displays an aggregate of all neutron counts
in the two-channel bins corresponding to neutron peak (and
corresponding SL counts) occurrence versus the channels in
between the peaks. As is clearly seen, the aggregate counts
per channel in the peak channels are very significantly
greater (by factor of ~50) than for the channels in between
the peaks. The corresponding SL counts are also higher by
~500%. In contrast, if the neutron pulses had been random
they would be spread out over the total time duration with no
such correlation being observed.
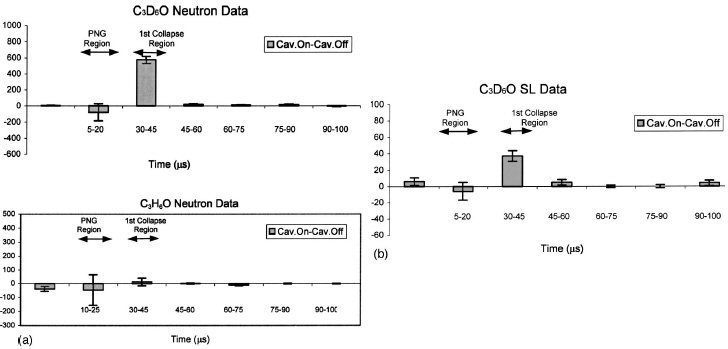
FIG. 7. (a) Change in neutron counts for chilled acetone with cavitation for the first 100 ms (acetone at 0 °C; PNG drive frequency
~200 Hz; acoustic forcing frequency =~19.3 kHz; error bars are 1 SD). (b) Corresponding change in SL counts for acetone for first 100 ms.
|
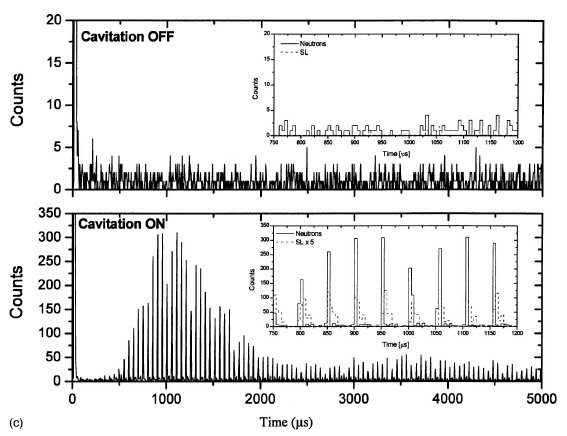
FIG. 7. (c) Composite plots showing time correlation between neutron and SL counts over 5000 ms for cases of cavitation off and cavitation on
(C3D6O at ~0 °C; PNG operation at 200 Hz).
|
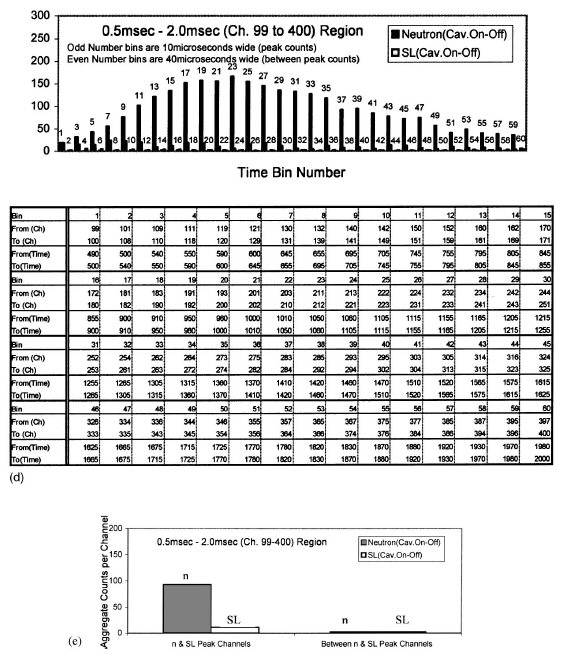
FIG. 7. (d) Time correlation between neutron and SL counts between 0.5 and 2.0 msec. (Cavitation on–cavitation off; C3D6O at ;0 °C; PNG operation at ;200 Hz.) (e) Variation of aggregate neutron and SL counts in peak and in-between peak regions between 0.5 and 2.0 msec. (Cavitation on–cavitation off; C3D6O at ;0 °C; PNG operation at ~200 Hz. Neutron counts per channel in peak channels are about 50 times larger than for remaining channels; the corresponding SL counts per channel in peak channels are about 5 times larger.) |
We also measured the energy (i.e., pulse height) spectra of
the neutron counts with and without cavitation for experiments
with C3H6O and C3D6O to determine the energy level
of the neutrons that are emitted. Representative results,
shown in Figs. 8(a), 8(b), and 8(c), were taken with the Spectrum
Techniques UCS-20™ MCA used in collecting the neutron
counts. It should be noted that a statistically significant
increase (.25– 50 SD) in neutron emission occurred [14]
only when there was cavitation and only when chilled
C3D6O was the test liquid. In Fig. 8(c)we see that such an
increase of counts takes place sharply at and below the ~;2.5 MeV PRE, indicating the emission of neutrons that are
peaked in energy at ~2.5 MeV. No such change was noted
in the higher energy channels, and none for conditions without
cavitation, and also none for tests with the control liquid,
C3H6O as seen from Fig. 8(b).
The neutron emission rate from our MCS/MCA data acquisition
system (which varied between ~60 and ~225 cps
from run to run), when divided by the calibrated efficiency
for fast (<4 MeV) neutron detection gives a net emission rate varying from ~(1–4)x10^5 n/s (at ~2.5 MeV), which,
as will be discussed below, is well within experimental uncertainties
for the inferred neutron emission rate of
~(3.5– 5)x10^5 n/s from the tritium data.
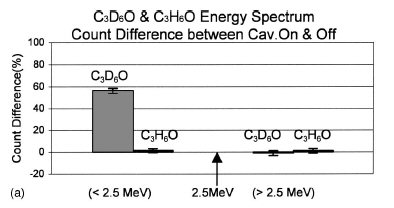
FIG. 8. (a) Changes in neutron counts below and above 2.5
MeV for tests with C3D6O and C3H6O at ;0 °C with and without
cavitation. (PNG drive frequency =200 Hz. Acoustic drive
frequencies =~19.3 kHz and =~20.3 kHz for C3D6O and C3H6O;
error bars are 1 SD.)
|
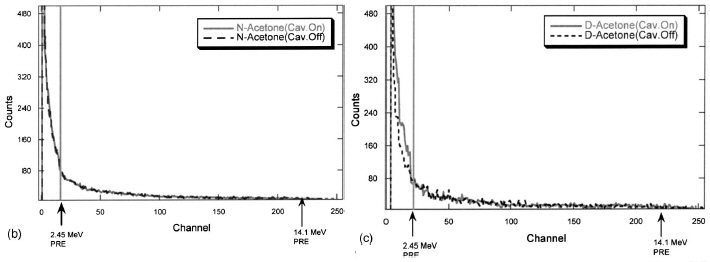
FIG. 8. (b) Representative neutron gated counts below and above 2.5 MeV proton recoil edge (PRE) for tests with C3H6O at ~0 °C with and without cavitation. (PNG drive frequency
=200 Hz. Acoustic drive frequencies =~20.3 kHz.) (c) Representative neutron gated counts below and above 2.5 MeV proton recoil edge (PRE) for tests with C3D6O at ~0 °C with and without cavitation. (PNG drive frequency =200 Hz. Acoustic drive frequencies =~19.3 kHz.) |
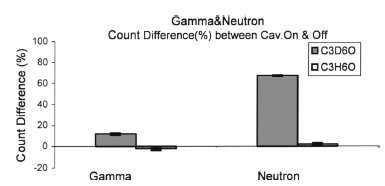
FIG. 9. Changes in gamma ray and neutron counts for tests with
C3D6O and C3H6O at ~0 °C with and without cavitation. (PNG
drive frequency =200 Hz. Acoustic drive frequencies =~19.3 kHz
and =~20.3 kHz for C3D6O and C3H6O; error bars are 1 SD.)
|
GAMMA RAY SPECTRA DATA
D-D fusion neutrons generated by imploding cavitation
bubbles immersed in liquid C3D6O can be expected to interact
with the various surrounding materials and structures resulting
in gamma ray emissions (principally from the capture
of thermalized neutrons by hydrogen in the liquid scintillator
and boron in the Pyrex glass test section).
Therefore, to
evaluate whether a measurable change in gamma ray emission
could be detected, we conducted experiments with and
without cavitation for chilled C3H6O and C3D6O, obtaining
the time and energy spectrum of counts in both the gamma
ray and neutron regions. The results, shown in Fig. 9, indicate
that for cavitation in chilled C3D6O the gamma ray
counts increased. In various different runs, the increase of
gamma ray counts varied from 10% to 20% of the increase in
neutron counts. The increase of counts in the neutron region
has been noted earlier to be >60 SD. The 10–20% increase
in counts in the gamma region time window amounts to a
change of >10 SD which is also very statistically significant.
This implies that some of the D-D neutrons emitted are captured
by the experimental apparatus. No such change was
noted for tests with C3H6O. Typical C3D6O gamma ray
emission energy spectra with cavitation (less those without
cavitation) are shown in Fig. 10. It was found that the increase
of gamma ray emissions was mainly (>80%) below
2.2 MeV (as would be expected from the capture of thermalized
neutrons by hydrogen and the boron in the Pyrex glass
test section). These results confirmed the accompaniment of
<2.5 MeV neutrons with a statistically significant emission
of gamma rays for cavitation experiments with C3D6O, but
not for tests with the control liquid, C3H6O.
CONFIRMATORY TRITIUM EXPERIMENTS
Following the experimental procedures developed previously [1], additional tests [12] were conducted for seven
hours to reconfirm [1] that a statistically significant quantity
of tritium (T) was generated during cavitation in chilled C3D6O (i.e, at ~0 °C). These tests were conducted with
deuterated acetone in a newly fabricated test section, and
they confirmed earlier findings [1], and indicated an increase
(over background! in tritium counts in the range of 4.5 to 5.9
cpm @with a 1 standard deviation (SD) of about 3 cpm]. This
represents an individual difference of up to ~2 SD and a
collective change of more than 3 SD. These data (i.e., tritium
decay at 4.5 to 5.9 cpm) imply an average neutron production
rate of between ~3x10^5 n/s to ~5x10^5 n/s, respectively.
Testing in the new chamber with natural acetone
(C3H6O) resulted in a change that was well within 1 SD
(i.e., no statistically significant change was found), in agreement
with previous findings [1]. For reference, these new
confirmatory data are shown together with past data [1] in
Fig. 11.
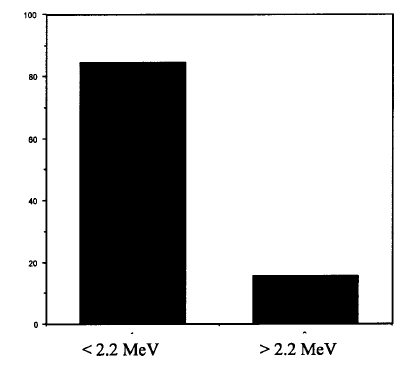
FIG. 10. Increase of sample gamma pulse height spectra fractional
distribution of counts above background with cavitation
(C3D6O at ~0 °C, PNG drive frequency ~200 Hz; acoustic drive
frequency =~19.3 kHz). |
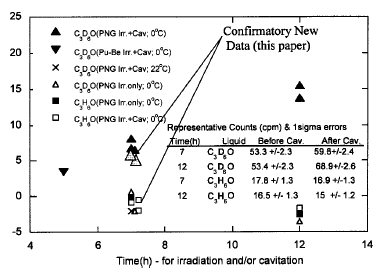
FIG. 11. Confirmatory tritium data together with prior data under
similar conditions [1]. |
To check for possible chemical effects, tests were also
conducted using a powerful acoustic horn [12] immersed
into C3H6O, and separately into C3D6O, to evaluate whether
cavitation of the type produced using conventional means
would produce any statistically significant change in the
readout for tritium content. The temperature of the acetone
was maintained at ~0°C and an acoustic horn operating at
an input power level of ~300 W was used to induce robust
cavitation at 20 kHz. The results revealed a negligible
change in counts in samples taken before and after cavitation,
amounting to about 0.1 cpm ~with 1 SD =~3.5 cpm)
for C3D6O, and about 1 cpm ~with a 1 SD =~2 cpm) for
C3H6O. These changes are well within 1 standard deviation
(SD), indicating negligible chemical effects contributing to
scintillation activity in the 5 to 18 keV beta decay window
characteristic of T decay. These data indicate that the effect
of any chemical activity on tritium measurements during
cavitation in our experiments is well below that caused by
nuclear fusion between deuterium atoms. Therefore, cavitation
with SL emanation from deuterated liquids by itself does
not lead to an increase of T counts. Indeed, statistically significant
quantities of tritium were found to be generated only
when we conducted cavitation experiments following the experimental
process outlined in Figs. 2 in chilled deuterated
acetone (C3D6O); a finding which was also supported by
hydrodynamic shock code simulations [1]. Previously we
had also conducted tests with cavitation at liquid temperatures
of ~20 °C and we did not find any statistically significant
change in counts for C3D6O nor C3H6O [1}. Finally, it
should be noted that these findings were also supported by
hydrodynamic shock code simulations [1].
SUMMARY AND CONCLUDING REMARKS
Large and statistically significant emissions of ~2.5 MeV
and below neutrons were noted during cavitation experiments
in chilled deuterated acetone. This neutron emission
was well separated in time from the neutrons generated by
the PNG (used to nucleate the cavitation bubbles) and was
time correlated with SL light emissions during bubble implosion
events. The neutron output during cavitation in chilled
deuterated acetone was found to be between ~1x10^5 n/s
and ~4x10^5 n/s. Statistically significant increases in tritium
were also measured during cavitation of chilled C3D6O
and the amount of tritium produced was consistent with the
measured DD neutron emissions. Statistically significant
gamma ray emissions were also measured in cavitation experiments
with chilled C3D6O. No statistically significant
change in neutron or gamma ray emissions and no significant
tritium generation were observed when there was no cavitation
in C3D6O and in control tests with C3H6O, both with
and without cavitation.
ACKNOWLEDGMENTS
Sponsorship of this research by the Defense Sciences
Office of the U.S. Defense Advanced Projects Agency is
gratefully acknowledged. We wish to acknowledge the one-on-one in-depth technical involvement, review, comments,and suggestions for improvement provided by Dr. Jack Harvey
of Physics Division, Oak Ridge National Laboratory (ORNL). Additionally, we are grateful to Professor Lee
Riedinger, of UT-Battelle, LLC-ORNL and Dr. Glenn Young
of Physics Division, ORNL for their in-depth technical reviews
and for arranging and coordinating intensive technical
reviews over several months by a multitude of scientific staff
at ORNL. We further sincerely thank and acknowledge technical
reviews by Professor Mark Embrechts and Professor Y.
Danon of Rensselaer Polytechnic Institute, Troy, NY, Professor
William Bugg, Physics Department and Physics Division
jointly of The University of Tennessee, Knoxville, TN and
ORNL, Professor Larry Miller of the University of Tennessee,
Knoxville, TN and ORNL, Dr. Larry Dubois of Stanford
Research Institute (previously of DARPA), and Ross Tessien,
Dr. Felipe Gaitan, and Dr. William Mead of Impulse Devices,
Inc. We also thank Dr. M. Murray, ORNL, for in-depth
and direct technical assistance for tritium measurements, and
E. Bickel of Channel Industries, Inc., Dr. F. Bergamo of Activations
Technologies, Inc., Dr. R. Stevens of Spectrum
Techniques, Dr. D. Gedcke of Ortec (Ametek), and Dr. D.
Neville of Canberra, Inc. for their valuable advice on nuclear
data acquisition. The support and oversight received from Dr.
W. Madia of UT-Battelle, LLC-ORNL were also valuable
and highly appreciated.
[1] R. P. Taleyarkhan et al., Science 295, 1868 ~2002!; R. Nigmatulin,
R. T. Lahey, Jr., and R. P. Taleyarkhan, Science Online,
www.sciencemag.org/cgi/content/full/295/5561/1868/
DC1, 2002.
[2] C. Siefe, Science 295, 1808 (2002).
[3] F. Bechetti, Science 295, 1850 (2002).
[4] A. Galonsky, Science 297, 1645 (2002); D. Shapira, M. Saltmarsh,
R. P. Taleyarkhan, R. C. Block, C. D. West, and R. T.
Lahey, Jr., ibid. 297, 1645 (2002); R. P. Taleyarkhan and S.
Putterman (private communication).
[5] B. Levi, Phys. Today 55(4), 16 (2002).
[6] D. Shapira and M. Saltmarsh, Phys. Rev. Lett. 89, 104302
(2002).
[7] The Alpha Spectra LS detector has dimensions of 5 cm (diameter)
by 5 cm (length). The scintillation liquid was EJ-301™
which is essentially the same as NE-213™. The test cell (a
Pyrex flask ~200 mm high365 mm O.D.), with a PZT driver,
was designed, fabricated, and set up at ORNL for experiments.
The MCA (UCS20™) used was procured from Spectrum Techniques,
Oak Ridge, TN, USA; the MCS-PCI™ was procured
from Ortec (Ametek), Oak Ridge, TN, USA and the AccuSpec-
FMS MCS was procured from Canberra, Inc. SL detection was
performed with a (2-ns rise time) PMT.
[8] N. P. Hawkes et al., Nucl. Instrum. Methods Phys. Res. A 476,
190 (2002).
[9] G. F. Knoll, Radiation Detection and Measurement (Wiley,
New York, 1989).
[10] J. Harvey and N. Hill, Nucl. Instrum. Methods 162, 507
(1979).
[11] The Pu-Be source used for efficiency and other calibrations
emits ~2x10^6 n/s, a large fraction of which has energies
below 4 MeV. The efficiency of detection of these neutrons by
the LS detector located about 18 cm away was found to be
~2x10^-4. This efficiency was corrected for the actual distance
(~7 cm) of the LS detector from the cavitation region,
and by a factor of 2 for the attenuation from interaction with
acetone atoms, giving a net detector efficiency of ~6
x10x-4, a value which is more than ten times greater than the
corresponding value reported earlier [1]. This is primarily at attributed
to the improved detector and electronics used along
with a lower bias level. The PNG emitted monoenergetic 14.1
MeV neutrons at a rate that is estimated to lie between
~(5–7)x10^5 n/s. The threshold was set at (0.7 MeV (corresponding
to ~0.7 MeV proton recoil energy).
[12] A Beckman LS6500™ scintillation counter, calibrated to detect
5- to 18-keV beta ray decays from T, was used. A 1-cm3
sample of test liquid was withdrawn from fluid in the top region
in the acoustic chamber after testing and mixed with 15
cm3 of Ecolite™ scintillation cocktail in a borosilicate glass
vial. When testing with C3D6O or C3H6O, with or without
irradiation or cavitation, we used the same experimental configuration,
including placing the chamber under standard
vacuum conditions. An acoustic horn system (by Misonix™
Corporation) was operated at 20 kHz and half of the ~660 W
nominal power to result in intense cavitation of the acetone
liquid. This power level was about 10 times the power level
used to drive the cylindrical PZT affixed to the glass chamber.
The tip was immersed into the liquid in the test section which
was held under vacuum. A cold air line maintained the temperature
of the system at ~0 °C.
[13] In Fig. 4, for the time span after PNG operation (from 30 ms to
5000 ms), counts collected with and without cavitation were
9869 and 2699, respectively. Assuming Poisson statistics, 1 SD
amounts to [square root of] 9869 +2699 =~112 counts. Therefore, the 7170
count increase above background represents a change of
~64 SD.
[14] In Fig. 8 the data presented were taken with a Spectrum Techniques
UCS20™ MCA in which the background counts from
the PNG were included. For the specific discriminator settings
and for these test runs with deuterated acetone with and without
cavitation, 8347 and 5337 neutrons were counted for the
channels below the 2.5 MeV cutoff, with 4193 and 4231
counts above the 2.5 MeV cutoff, respectively. Assuming Poisson
statistics, 1 SD amounts to ~117 counts. Therefore, the
3010 count increase above background in the <2.5 MeV range
represents a change of ~26 SD. Corresponding 1 SD values
are shown in Fig. 8 for the various cases cited therein.
(In accordance with Title 17, Section 107, of the U.S. Code, this material
is distributed without profit to those who have expressed a prior interest
in receiving the included information for research and educational
purposes. New Energy Times has no affiliation whatsoever with the
originator of the original text in this article; nor is New Energy Times
endorsed or sponsored by the originator.)
"Go to Original" links are provided as a convenience to our readers and allow for verification of authenticity. However, as originating pages are often updated by their originating host sites, the versions posted on New Energy Times may not match the versions our readers view when clicking the "Go to Original" links.
|